

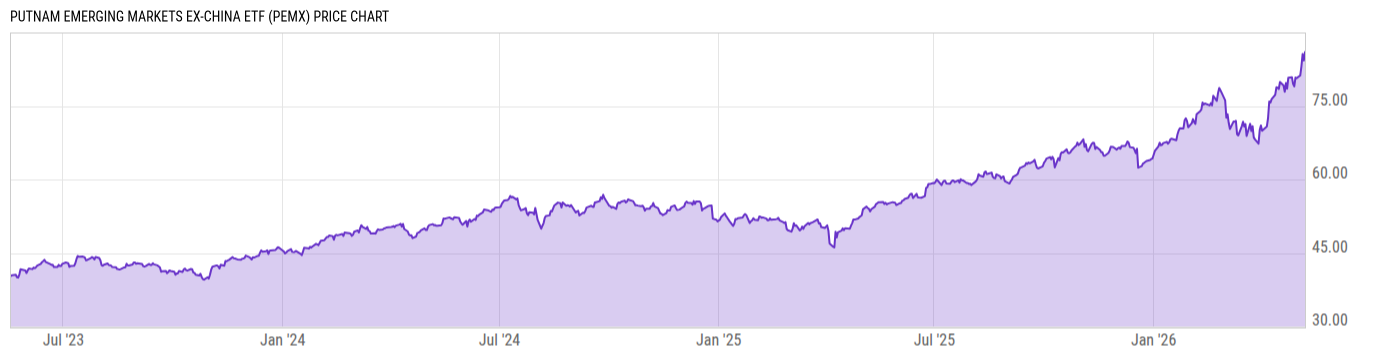
Putnam Emerging Markets ex-China ETF (PEMX)
82.62
-6.66
(-7.46%)
USD |
NYSEARCA |
Jun 05, 16:00
Price Chart
Key Stats
| Net Expense Ratio | Discount or Premium to NAV | Total Assets Under Management | 30-Day Average Daily Volume |
|---|---|---|---|
| 0.69% | -4.80% | 21.70M | 649.90 |
| Weighted Average Dividend Yield | Turnover Ratio (Generic) | 1 Year Fund Level Flows | Max Drawdown (Since Inception) |
| 1.97% | 53.00% | 359761.0 |
Basic Info
| Investment Strategy | |
| The Fund seeks long term capital appreciation. The fund invests mainly, at least 80% of the funds net assets in the equity securities of emerging market companies excluding companies domiciled, or whose stock is listed for trading on an exchange, in China, as well as companies domiciled in Hong Kong. |
| General | |
| Security Type | Exchange-Traded Fund |
| Equity Style | Large Cap Growth |
| Broad Asset Class | International Equity |
| Broad Category | Equity |
| Global Peer Group | Equity Emerging Markets Global |
| Peer Group | Emerging Markets Funds |
| Global Macro | Equity Emerging Markets |
| US Macro | Emerging Markets Equity Funds |
| YCharts Categorization | -- |
| YCharts Benchmark | -- |
| Prospectus Objective | Emerging Markets Funds |
| Fund Owner Firm Name | Franklin Templeton |
| Broad Asset Class Benchmark Index | |
| ^MSACXUSNTR | 100.0% |
Performance Versus Peer Group
Annual Total Returns Versus Peers
As of June 08, 2026.
Asset Allocation
As of April 30, 2026.
| Type | % Net |
|---|---|
| Cash | 1.05% |
| Stock | 94.82% |
| Bond | 0.77% |
| Convertible | 0.00% |
| Preferred | 3.59% |
| Other | -0.23% |
Basic Info
| Investment Strategy | |
| The Fund seeks long term capital appreciation. The fund invests mainly, at least 80% of the funds net assets in the equity securities of emerging market companies excluding companies domiciled, or whose stock is listed for trading on an exchange, in China, as well as companies domiciled in Hong Kong. |
| General | |
| Security Type | Exchange-Traded Fund |
| Equity Style | Large Cap Growth |
| Broad Asset Class | International Equity |
| Broad Category | Equity |
| Global Peer Group | Equity Emerging Markets Global |
| Peer Group | Emerging Markets Funds |
| Global Macro | Equity Emerging Markets |
| US Macro | Emerging Markets Equity Funds |
| YCharts Categorization | -- |
| YCharts Benchmark | -- |
| Prospectus Objective | Emerging Markets Funds |
| Fund Owner Firm Name | Franklin Templeton |
| Broad Asset Class Benchmark Index | |
| ^MSACXUSNTR | 100.0% |