

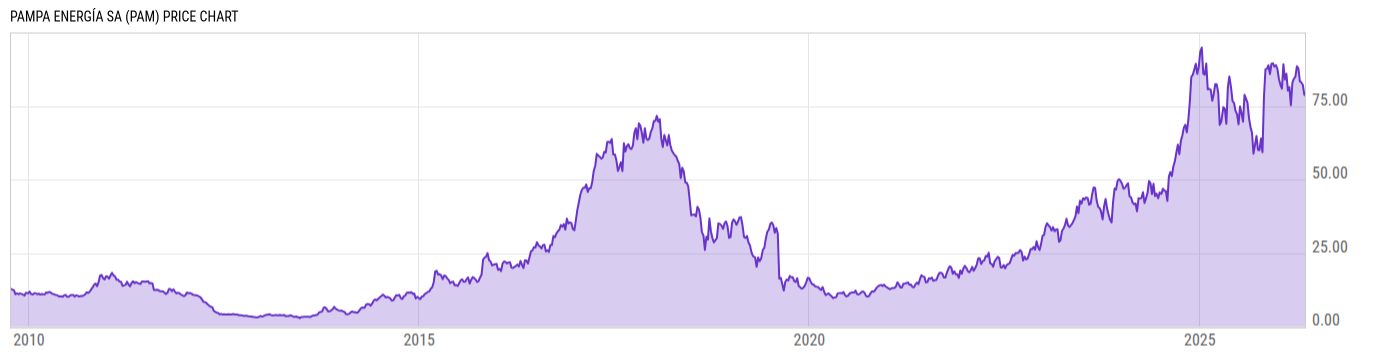
Pampa Energía SA (PAM)
85.25
+1.16
(+1.38%)
USD |
NYSE |
May 29, 16:00
85.36
+0.12
(+0.13%)
After-Hours: 20:00
Price Chart
Key Stats
| Price and Performance | |
|---|---|
| Market Cap | 4.636B |
| 52 Week High (Daily) | |
| 52 Week Low (Daily) | |
| All-Time High (Daily) | |
| Year to Date Total Returns (Daily) | |
| 1 Month Total Returns (Daily) | |
| 1 Year Total Returns (Daily) | 9.03% |
| Valuation | |
| PE Ratio | 11.64 |
| PE Ratio (Forward) | |
| PS Ratio | 2.291 |
| Price to Book Value | 1.286 |
| EV to EBITDA | |
| Dividend | |
|---|---|
| Dividend | -- |
| Dividend Yield (Forward) | |
| Financials | |
| Revenue (5 Year Growth) | |
| Revenue (Quarterly YoY Growth) | |
| EPS Diluted (5 Year Growth) | |
| EPS Diluted (Quarterly YoY Growth) | |
| Debt to Equity Ratio | 0.5363 |
| Return on Equity | |
| Return on Assets | |
| Risk | |
| Beta (5Y) | |
| Max Drawdown (5Y) | 81.37% |
Profile
| Pampa Energía SA engages in the generation, transmission, and distribution of electricity. It operates through the following segments: Electricity Generation, Distribution of Energy, Oil and Gas, Petrochemicals, and Holding and Others. The Electricity Generation segment includes electricity generation activities through the operation of hydro and thermal power plants as well as wind farms. The Distribution of Energy segment consists of direct interest in Empresa Distribuidora y Comercializadora Norte SA. The Oil and Gas segment develops upstream, midstream, and downstream activities that produce barrels of oil. The Petrochemicals segment comprises styrenics operations and catalytic reformer plant operations conducted in Argentine plants. The Holding and Others segment covers financial investment transactions, holding activities, concession over the high voltage electricity transmission, and over gas transportation. The company was founded on February 21, 1945 and is headquartered in Buenos Aires, Argentina. |
| URL | http://www.pampa.com |
| Investor Relations URL | https://ri.pampa.com/en/ |
| HQ State/Province | Buenos Aires |
| Sector | Utilities |
| Industry | Electric Utilities |
| Next Earnings Release | Aug. 05, 2026 (est.) |
| Last Earnings Release | May. 06, 2026 |
| Next Ex-Dividend Date | N/A |
| Last Ex-Dividend Date | Jan. 11, 2011 |