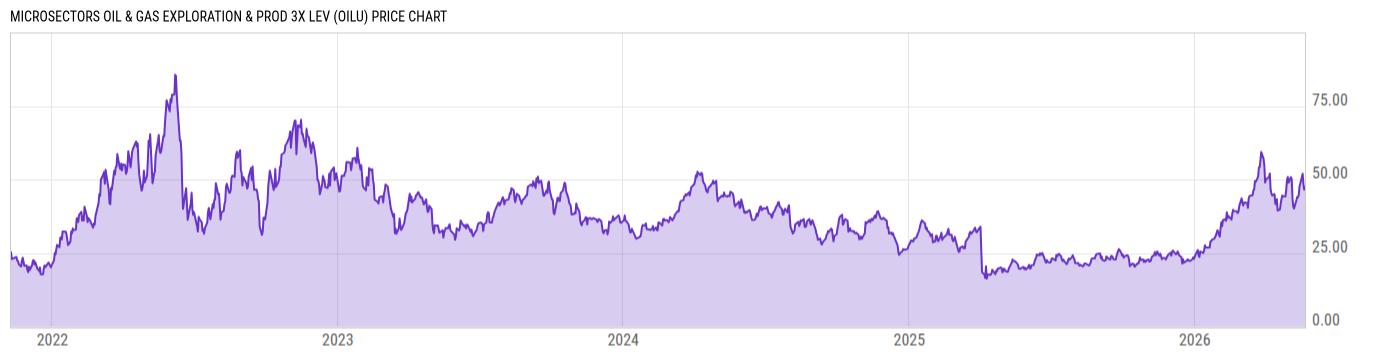
MicroSectorsTM Oil&Gs Exp&Pd 3X Lvg ETNs (OILU)
41.62
+2.30 (+5.85%)
USD |
NYSEARCA |
Aug 09, 16:00
41.29
-0.33 (-0.79%)
After-Hours: 20:00
Price Chart
Key Stats
Customize
Expense Ratio | Discount or Premium to NAV | Total Assets Under Management | 30-Day Average Daily Volume |
---|---|---|---|
0.95% | 0.04% | 41.59M | 197921.3 |
Dividend Yield | Turnover Ratio | 1 Year Fund Level Flows | Max Drawdown (All) |
0% | -- | -- | Upgrade |
Basic Info
Investment Strategy | |
The investment seeks to reflect a 3x leveraged long exposure to the performance of the Solactive MicroSectorsTM Oil & Gas Exploration & Production Index on a daily basis. The index is a total return index that tracks the stock prices of large-capitalization companies that are domiciled and listed in the U.S. and that are active in the exploration and production of oil and gas. The notes are unsecured and unsubordinated obligations of Bank of Montreal. Each note will have an initial principal amount of $25. The notes do not bear interest. |
General | |
Security Type | Exchange-Traded Fund |
Equity Style | Large Cap/Value |
Fixed Income Style | -- |
Broad Asset Class | Miscellaneous |
Broad Category | Miscellaneous |
Category Name | Trading--Leveraged Equity |
Category Index | -- |
Prospectus Objective | Specialty - Natural Resources |
Fund Owner Firm Name | BMO Capital Markets |
Prospectus Benchmark Index | |
Solactive MicroSec O & G Ex&Pro TR USD | 300.0% |
Broad Asset Class Benchmark Index | |
^SPXTR | 100.0% |
Manager Tenure | |
No Manager | 0.73 yrs |
Net Fund Flows Versus Category
1 Month
% Rank:
--
--
Category Low
--
Category High
1 Year
% Rank:
--
-746.42M
Category Low
10.67B
Category High
3 Months
% Rank:
--
--
Category Low
--
Category High
3 Years
% Rank:
--
--
Category Low
--
Category High
6 Months
% Rank:
--
--
Category Low
--
Category High
5 Years
% Rank:
--
--
Category Low
--
Category High
YTD
% Rank:
--
--
Category Low
--
Category High
10 Years
% Rank:
--
--
Category Low
--
Category High
As of July 31, 2022
Performance Versus Category
As of August 08, 2022. Returns for periods of 1 year and above are annualized.
Annual Total Returns Versus Peers
As of August 08, 2022.
Asset Allocation
Top 10 Holdings
Name | % Weight | Price | % Change |
---|---|---|---|
Chevron Corp | 15.00% | 155.41 | 1.30% |
Exxon Mobil Corp | 15.00% | 90.59 | 1.84% |
ConocoPhillips | 6.46% | 95.51 | 2.01% |
Occidental Petroleum Corp | 5.93% | 62.41 | 3.95% |
Devon Energy Corp | 5.13% | 59.04 | 2.64% |
Marathon Petroleum Corp | 4.70% | 93.35 | 3.27% |
Schlumberger Ltd | 4.24% | 34.99 | 0.98% |
Pioneer Natural Resources Co | 4.22% | 218.19 | 0.48% |
EOG Resources Inc | 4.07% | 108.24 | 0.98% |
Valero Energy Corp | 3.17% | 110.67 | 4.02% |
News
Headline
Wire
Time (ET)
Basic Info
Investment Strategy | |
The investment seeks to reflect a 3x leveraged long exposure to the performance of the Solactive MicroSectorsTM Oil & Gas Exploration & Production Index on a daily basis. The index is a total return index that tracks the stock prices of large-capitalization companies that are domiciled and listed in the U.S. and that are active in the exploration and production of oil and gas. The notes are unsecured and unsubordinated obligations of Bank of Montreal. Each note will have an initial principal amount of $25. The notes do not bear interest. |
General | |
Security Type | Exchange-Traded Fund |
Equity Style | Large Cap/Value |
Fixed Income Style | -- |
Broad Asset Class | Miscellaneous |
Broad Category | Miscellaneous |
Category Name | Trading--Leveraged Equity |
Category Index | -- |
Prospectus Objective | Specialty - Natural Resources |
Fund Owner Firm Name | BMO Capital Markets |
Prospectus Benchmark Index | |
Solactive MicroSec O & G Ex&Pro TR USD | 300.0% |
Broad Asset Class Benchmark Index | |
^SPXTR | 100.0% |
Manager Tenure | |
No Manager | 0.73 yrs |
Fundamentals
General | |
Distribution Yield | Upgrade |
Dividend Yield TTM (8-9-22) | 0% |
30-Day SEC Yield | -- |
7-Day SEC Yield | -- |
Number of Holdings | Upgrade |
Stock | |
Weighted Average PE Ratio | 19.53 |
Weighted Average Price to Sales Ratio | Upgrade |
Weighted Average Price to Book Ratio | Upgrade |
Weighted Median ROE | Upgrade |
Weighted Median ROA | Upgrade |
Forecasted Dividend Yield | Upgrade |
Forecasted PE Ratio | Upgrade |
Forecasted Price to Sales Ratio | Upgrade |
Forecasted Price to Book Ratio | Upgrade |
As of March 31, 2022
Growth Estimates
Fund Details
Key Dates | |
Inception Date | 11/8/2021 |
Last Annual Report Date | -- |
Last Prospectus Date | -- |
Attributes | |
Enhanced Index Fund | No |
Index Fund |
|
Inverse Fund | No |
Leveraged Fund |
|
Fund of Funds | No |
Currency Hedged Fund | No |
Synthetic Replication Fund | No |
Has Dividend Investment Plan | No |
Socially Responsible Fund | No |
News
Headline
Wire
Time (ET)