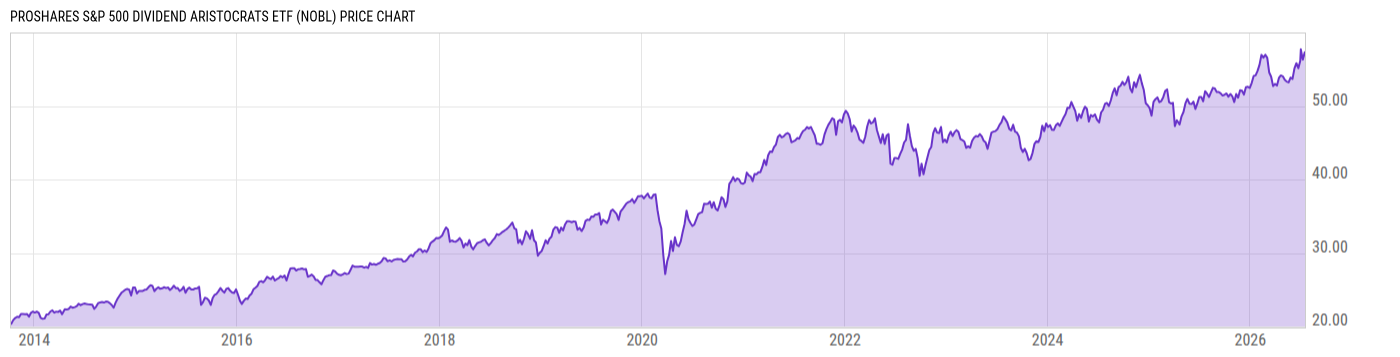
ProShares S&P 500 Dividend Aristocrats (NOBL)
80.81
-0.63 (-0.77%)
USD |
Jan 21, 20:00
Price Chart
Key Stats
Customize
Expense Ratio | Discount or Premium to NAV | Total Assets Under Management | 30-Day Average Daily Volume |
---|---|---|---|
0.35% | -0.03% | 7.150B | 445149.2 |
Dividend Yield | Turnover Ratio | 1 Year Fund Level Flows | Max Drawdown (All) |
2.11% | 29.00% | 187.87M | Upgrade |
Basic Info
Investment Strategy | |
The investment seeks investment results, before fees and expenses, that track the performance of the S&P 500® Dividend Aristocrats® Index (the "index"). The fund will invest at least 80% of its total assets in component securities of the index. The index contains a minimum of 40 stocks, which are equally weighted, and no single sector is allowed to comprise more than 30% of the index weight. It seeks to remain fully invested at all times in securities and/or financial instruments that, in combination, provide exposure to the returns of the index without regard to market conditions, trends or direction. |
General | |
Security Type | Exchange-Traded Fund |
Equity Style | Large Cap/Value |
Fixed Income Style | -- |
Broad Asset Class | US Equity |
Broad Category | Equity |
Category Name | Large Blend |
Category Index | Russell 1000 TR USD |
Prospectus Objective | Growth |
Fund Owner Firm Name | ProShares |
Prospectus Benchmark Index | |
S&P 500 Dividend Aristocrats TR USD | 100.0% |
Broad Asset Class Benchmark Index | |
^SPXTR | 100.0% |
Manager Tenure | |
Michael Neches | 7.24 yrs |
Devin Sullivan | 2.68 yrs |
Net Fund Flows Versus Category
1 Month
% Rank:
--
--
Category Low
--
Category High
1 Year
% Rank:
11
187.87M
-25.66B
Category Low
10.63B
Category High
3 Months
% Rank:
--
--
Category Low
--
Category High
3 Years
% Rank:
--
--
Category Low
--
Category High
6 Months
% Rank:
--
--
Category Low
--
Category High
5 Years
% Rank:
--
--
Category Low
--
Category High
YTD
% Rank:
--
--
Category Low
--
Category High
10 Years
% Rank:
--
--
Category Low
--
Category High
As of December 31, 2020
Performance Versus Category
As of January 21, 2021. Returns for periods of 1 year and above are annualized.
Annual Total Returns Versus Peers
Edit comparables
As of January 21, 2021.
Asset Allocation
Top 10 Holdings
Name | % Weight | Price | % Change |
---|---|---|---|
Albemarle Corp | 2.21% | 176.41 | -2.10% |
AbbVie Inc | 1.83% | 111.26 | -1.21% |
Exxon Mobil Corp | 1.74% | 48.11 | -2.87% |
Chubb Ltd | 1.72% | 157.17 | 0.87% |
Automatic Data Processing Inc | 1.70% | 161.03 | -0.81% |
Aflac Inc | 1.69% | 46.32 | -1.57% |
Essex Property Trust Inc | 1.68% | 245.20 | 0.17% |
Chevron Corp | 1.68% | 92.01 | -3.53% |
Emerson Electric Co | 1.65% | 84.26 | -0.15% |
Sysco Corp | 1.65% | 76.83 | -0.25% |
News
Headline
Wire
Time (ET)
SA Breaking News
03/27 10:34
Business Wire
06/17 16:15
Business Wire
07/25 09:00
Basic Info
Investment Strategy | |
The investment seeks investment results, before fees and expenses, that track the performance of the S&P 500® Dividend Aristocrats® Index (the "index"). The fund will invest at least 80% of its total assets in component securities of the index. The index contains a minimum of 40 stocks, which are equally weighted, and no single sector is allowed to comprise more than 30% of the index weight. It seeks to remain fully invested at all times in securities and/or financial instruments that, in combination, provide exposure to the returns of the index without regard to market conditions, trends or direction. |
General | |
Security Type | Exchange-Traded Fund |
Equity Style | Large Cap/Value |
Fixed Income Style | -- |
Broad Asset Class | US Equity |
Broad Category | Equity |
Category Name | Large Blend |
Category Index | Russell 1000 TR USD |
Prospectus Objective | Growth |
Fund Owner Firm Name | ProShares |
Prospectus Benchmark Index | |
S&P 500 Dividend Aristocrats TR USD | 100.0% |
Broad Asset Class Benchmark Index | |
^SPXTR | 100.0% |
Manager Tenure | |
Michael Neches | 7.24 yrs |
Devin Sullivan | 2.68 yrs |
Fundamentals
General | |
Distribution Yield | Upgrade |
Dividend Yield TTM (1-21-21) | 2.11% |
30-Day SEC Yield | -- |
7-Day SEC Yield | -- |
Number of Holdings | Upgrade |
Stock | |
Weighted Average PE Ratio | 25.95 |
Weighted Average Price to Sales Ratio | Upgrade |
Weighted Average Price to Book Ratio | Upgrade |
Weighted Median ROE | Upgrade |
Weighted Median ROA | Upgrade |
Forecasted Dividend Yield | Upgrade |
Forecasted PE Ratio | Upgrade |
Forecasted Price to Sales Ratio | Upgrade |
Forecasted Price to Book Ratio | Upgrade |
As of December 31, 2020
Growth Estimates
Fund Details
Key Dates | |
Inception Date | 10/9/2013 |
Last Annual Report Date | 5/31/2020 |
Last Prospectus Date | 10/1/2020 |
Attributes | |
Enhanced Index Fund | No |
Index Fund |
|
Inverse Fund | No |
Leveraged Fund | No |
Fund of Funds | No |
Currency Hedged Fund | No |
Synthetic Replication Fund | No |
Has Dividend Investment Plan | No |
Socially Responsible Fund | No |
News
Headline
Wire
Time (ET)
SA Breaking News
03/27 10:34
Business Wire
06/17 16:15
Business Wire
07/25 09:00