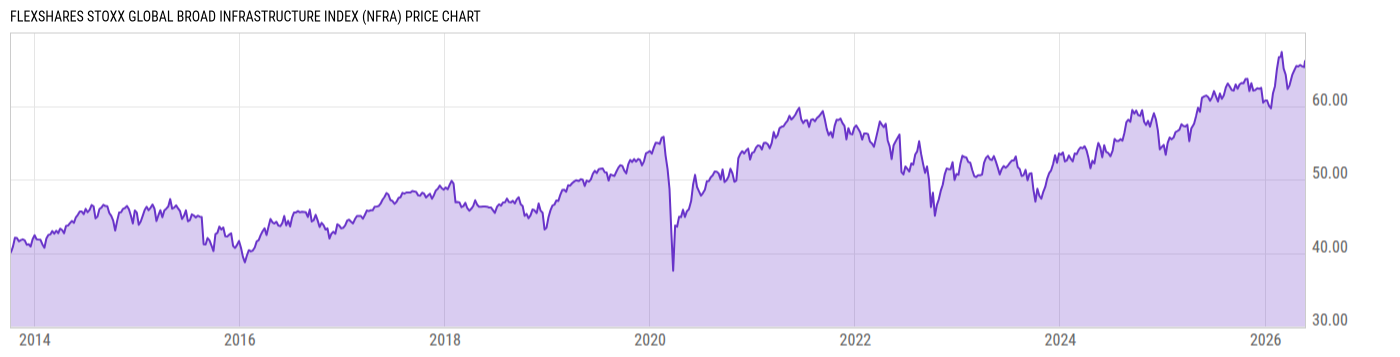
Key Stats

Expense Ratio Discount or Premium to NAV Total Assets Under Management 30-Day Average Daily Volume
0.47% -0.51% 2.285B 79158.37
Dividend Yield Turnover Ratio 1 Year Fund Level Flows Max Drawdown (All)
2.23% 16.00% -24.71M Upgrade

Basic Info

Investment Strategy
The investment seeks investment results that correspond generally to the price and yield performance, before fees and expenses, of the STOXX® Global Broad Infrastructure Index. The index reflects the performance of a selection of companies that, in aggregate, offer broad exposure to publicly-traded developed- and emerging-market infrastructure companies, including U.S. companies, as defined by STOXX Ltd. (the "index provider") pursuant to its index methodology. Under normal circumstances, the fund will invest at least 80% of its total assets in the securities of the index and in ADRs and GDRs based on the securities in the index.
General
Security Type Exchange-Traded Fund
Equity Style Large Cap/Blend
Fixed Income Style --
Broad Asset Class Sector Equity
Broad Category Equity
Category Name Infrastructure
Category Index S&P Global Infrastructure NR USD
Global Category Name Infrastructure Sector Equity
YCharts Categorization Infrastructure Equity
YCharts Benchmark MSCI ACWI Infrastructure (^MSACWIIA)
Prospectus Objective Specialty - Utility
Fund Owner Firm Name Flexshares Trust
Prospectus Benchmark Index
STOXX Global Broad Infrastructure NR USD 100.0%
Broad Asset Class Benchmark Index
^MSWNTR 100.0%
Manager Tenure
Robert Anstine 9.40 yrs
Brendan Sullivan 6.70 yrs
Volter Bagriy 2.00 yrs

Net Fund Flows Versus Category

View Net Fund Flows. Upgrade now.
1M
3M
6M
YTD
1Y
3Y
5Y
10Y
 
80.00B
60.00B
40.00B
20.00B
0
-20.00B
1 Month
% Rank: --
-- Category Low
-- Category High
1 Year
% Rank: 64
-24.71M
-1.233B Category Low
998.04M Category High
3 Months
% Rank: --
-- Category Low
-- Category High
3 Years
% Rank: --
-- Category Low
-- Category High
6 Months
% Rank: --
-- Category Low
-- Category High
5 Years
% Rank: --
-- Category Low
-- Category High
YTD
% Rank: --
-- Category Low
-- Category High
10 Years
% Rank: --
-- Category Low
-- Category High
As of February 28, 2023

Performance Versus Category

 
20%
15%
10%
5%
0
View Category Returns. Upgrade now.
Name
1M
3M
YTD
1Y
3Y
5Y
10Y
15Y
Total Return (Price)
--
--
--
--
--
--
--
--
Total Return (NAV)
--
--
--
--
--
--
--
--
Category Rtn. (NAV)
--
--
--
--
--
--
--
--
% Rank in Cat (NAV)
--
--
--
--
--
--
--
--
As of March 23, 2023. Returns for periods of 1 year and above are annualized.

Annual Total Returns Versus Peers

Loading chart...
Name
2016
2017
2018
2019
2020
2021
2022
YTD
8.34%
15.93%
-7.72%
26.26%
2.28%
9.63%
-10.10%
-0.83%
7.51%
22.40%
-8.71%
27.67%
15.90%
21.82%
-18.14%
3.98%
11.86%
19.34%
-9.94%
25.81%
-6.50%
11.58%
-1.23%
-0.02%
12.21%
34.11%
-9.86%
42.78%
6.88%
17.96%
-9.56%
-5.41%
11.71%
19.05%
-10.06%
26.30%
-6.82%
11.40%
-0.51%
-0.16%
12.10%
13.29%
-7.94%
26.85%
-9.45%
20.47%
-4.23%
-2.13%
As of March 23, 2023.

Fundamentals

General
Distribution Yield Upgrade
Dividend Yield TTM (3-24-23) 2.23%
30-Day SEC Yield --
7-Day SEC Yield --
Number of Holdings Upgrade
Stock
Weighted Average PE Ratio 19.09
Weighted Average Price to Sales Ratio Upgrade
Weighted Average Price to Book Ratio Upgrade
Weighted Median ROE Upgrade
Weighted Median ROA Upgrade
Forecasted Dividend Yield Upgrade
Forecasted PE Ratio Upgrade
Forecasted Price to Sales Ratio Upgrade
Forecasted Price to Book Ratio Upgrade
As of March 22, 2023

Growth Estimates

Forecasted 5 Yr Earnings Growth Upgrade
Forecasted Book Value Growth Upgrade
Forecasted Cash Flow Growth Upgrade
Forecasted Earnings Growth Upgrade
Forecasted Revenue Growth Upgrade
As of March 22, 2023

Asset Allocation

As of March 22, 2023.
Type % Net % Long % Short
Cash 0.63% Upgrade Upgrade
Stock 99.35% Upgrade Upgrade
Bond 0.00% Upgrade Upgrade
Convertible 0.00% Upgrade Upgrade
Preferred 0.00% Upgrade Upgrade
Other 0.02% Upgrade Upgrade

Top 10 Holdings

Name % Weight Price % Change
Canadian National Railway Co 4.12% 155.44 0.54%
Canadian Pacific Railway Ltd 4.12% 102.96 0.36%
Verizon Communications Inc 2.89% 37.66 0.78%
Comcast Corp Class A 2.81% 36.03 0.17%
Enbridge Inc 2.78% 50.37 0.76%
NextEra Energy Inc 2.73% 75.53 2.33%
Deutsche Telekom AG 2.73% 23.42 -0.66%
Iberdrola SA 2.63% 11.92 -1.08%
Deutsche Post AG 2.62% 44.72 -1.76%
Nippon Telegraph & Telephone Corp 2.51% 30.24 -0.69%

Basic Info

Investment Strategy
The investment seeks investment results that correspond generally to the price and yield performance, before fees and expenses, of the STOXX® Global Broad Infrastructure Index. The index reflects the performance of a selection of companies that, in aggregate, offer broad exposure to publicly-traded developed- and emerging-market infrastructure companies, including U.S. companies, as defined by STOXX Ltd. (the "index provider") pursuant to its index methodology. Under normal circumstances, the fund will invest at least 80% of its total assets in the securities of the index and in ADRs and GDRs based on the securities in the index.
General
Security Type Exchange-Traded Fund
Equity Style Large Cap/Blend
Fixed Income Style --
Broad Asset Class Sector Equity
Broad Category Equity
Category Name Infrastructure
Category Index S&P Global Infrastructure NR USD
Global Category Name Infrastructure Sector Equity
YCharts Categorization Infrastructure Equity
YCharts Benchmark MSCI ACWI Infrastructure (^MSACWIIA)
Prospectus Objective Specialty - Utility
Fund Owner Firm Name Flexshares Trust
Prospectus Benchmark Index
STOXX Global Broad Infrastructure NR USD 100.0%
Broad Asset Class Benchmark Index
^MSWNTR 100.0%
Manager Tenure
Robert Anstine 9.40 yrs
Brendan Sullivan 6.70 yrs
Volter Bagriy 2.00 yrs

Fundamentals

General
Distribution Yield Upgrade
Dividend Yield TTM (3-24-23) 2.23%
30-Day SEC Yield --
7-Day SEC Yield --
Number of Holdings Upgrade
Stock
Weighted Average PE Ratio 19.09
Weighted Average Price to Sales Ratio Upgrade
Weighted Average Price to Book Ratio Upgrade
Weighted Median ROE Upgrade
Weighted Median ROA Upgrade
Forecasted Dividend Yield Upgrade
Forecasted PE Ratio Upgrade
Forecasted Price to Sales Ratio Upgrade
Forecasted Price to Book Ratio Upgrade
As of March 22, 2023

Growth Estimates

Forecasted 5 Yr Earnings Growth Upgrade
Forecasted Book Value Growth Upgrade
Forecasted Cash Flow Growth Upgrade
Forecasted Earnings Growth Upgrade
Forecasted Revenue Growth Upgrade
As of March 22, 2023

Fund Details

Key Dates
Inception Date 10/8/2013
Last Annual Report Date 10/31/2022
Last Prospectus Date 3/1/2023
Attributes
Index Fund Yes
Inverse Fund No
Leveraged Fund No
Fund of Funds No
Currency Hedged Fund No
Synthetic Replication Fund No
Has Dividend Investment Plan No
Socially Responsible Fund No

Top Portfolio Holders

0 of 0