

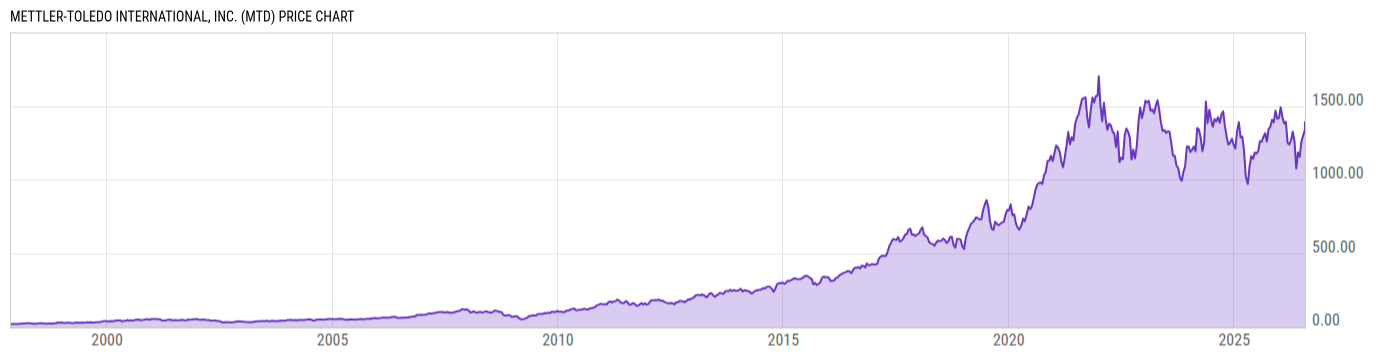
Mettler-Toledo International, Inc. (MTD)
1388.67
+52.38
(+3.92%)
USD |
NYSE |
Jul 28, 16:00
1389.30
+0.64
(+0.05%)
After-Hours: 19:21
Price Chart
Key Stats
| Price and Performance | |
|---|---|
| Market Cap | 28.06B |
| 52 Week High (Daily) | |
| 52 Week Low (Daily) | |
| All-Time High (Daily) | |
| Year to Date Total Returns (Daily) | |
| 1 Month Total Returns (Daily) | |
| 1 Year Total Returns (Daily) | 5.72% |
| Valuation | |
| PE Ratio | 32.57 |
| PE Ratio (Forward) | |
| PS Ratio | 6.969 |
| Price to Book Value | -- |
| EV to EBITDA | |
| Dividend | |
|---|---|
| Dividend | -- |
| Dividend Yield (Forward) | |
| Financials | |
| Revenue (5 Year Growth) | |
| Revenue (Quarterly YoY Growth) | |
| EPS Diluted (5 Year Growth) | |
| EPS Diluted (Quarterly YoY Growth) | |
| Debt to Equity Ratio | -53.21 |
| Return on Equity | |
| Return on Assets | |
| Risk | |
| Beta (5Y) | |
| Max Drawdown (5Y) | 43.47% |
Profile
| Mettler-Toledo International, Inc. engages in the provision of precision instruments and services. The firm manufactures weighing instruments for use in laboratory, industrial, packaging, logistics, and food retailing applications. It also manufactures several related analytical instruments and provides automated chemistry solutions used in drug and chemical compound discovery and development, metal detection and other end-of-line inspection systems used in production and packaging and provides solutions for use in certain process analytics applications. It operates through the following segments: U.S. Operations, Swiss Operations, Western European Operations, Chinese Operations, and Other Operations. The U.S. Operations segment represents certain of the company's marketing and producing organizations located in the United States. The Swiss Operations segment is involved in the marketing and producing organizations located in Switzerland, as well as extensive research and development operations that are responsible for the development, production, and marketing of precision instruments, including weighing, analytical, and measurement technologies for use in a variety of industrial, and laboratory applications. The Western European Operations segment includes marketing and producing organizations in Western Europe, excluding operations located in Switzerland. The Chinese Operations segment focuses on marketing and producing organizations located in China. The Other Operations segment refers to the operations that exist outside these reportable segments. The company was founded in 1991 and is headquartered in Columbus, OH. |
| URL | http://www.mt.com |
| Investor Relations URL | https://investor.mt.com/investor-home/default.aspx |
| HQ State/Province | Ohio |
| Sector | Health Care |
| Industry | Life Sciences Tools & Services |
| Equity Style | Mid Cap Core |
| Next Earnings Release | Jul. 30, 2026 |
| Last Earnings Release | May. 07, 2026 |
| Next Ex-Dividend Date | N/A |
| Last Ex-Dividend Date | N/A |