

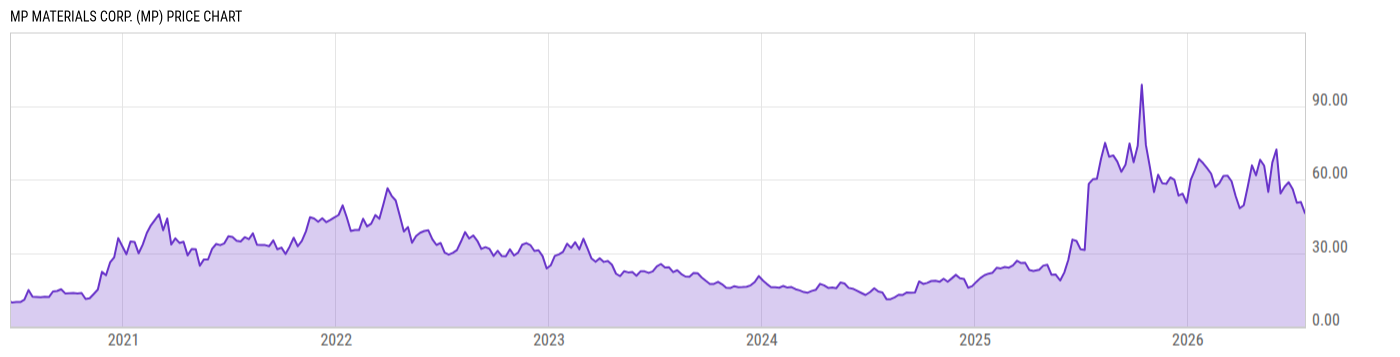
MP Materials Corp. (MP)
46.31
+0.61
(+1.33%)
USD |
NYSE |
Jul 21, 16:00
46.64
+0.32
(+0.70%)
After-Hours: 20:00
Price Chart
Key Stats
| Price and Performance | |
|---|---|
| Market Cap | 8.228B |
| 52 Week High (Daily) | |
| 52 Week Low (Daily) | |
| All-Time High (Daily) | |
| Year to Date Total Returns (Daily) | |
| 1 Month Total Returns (Daily) | |
| 1 Year Total Returns (Daily) | -27.71% |
| Valuation | |
| PE Ratio | -- |
| PE Ratio (Forward) | |
| PS Ratio | 23.85 |
| Price to Book Value | 4.183 |
| EV to EBITDA | |
| Dividend | |
|---|---|
| Dividend | -- |
| Dividend Yield (Forward) | |
| Financials | |
| Revenue (5 Year Growth) | |
| Revenue (Quarterly YoY Growth) | |
| EPS Diluted (5 Year Growth) | |
| EPS Diluted (Quarterly YoY Growth) | |
| Debt to Equity Ratio | 0.4402 |
| Return on Equity | |
| Return on Assets | |
| Risk | |
| Beta (5Y) | |
| Max Drawdown (5Y) | 81.99% |
Profile
| MP Materials Corp. engages in the production and marketing of rare earth specialty materials. It operates through the following segments: Materials and Magnetics. The Materials segment focuses on the operation of Mountain Pass, which produces refined rare earth oxides and related products, as well as rare earth concentrate products. The Magnetics segment is involved in the operation of Independence Facility, where the company began production of magnetic precursor products. The company was founded by James Henry Litinsky and Michael Rosenthal in 2017 and is headquartered in Las Vegas, NV. |
| URL | http://www.mpmaterials.com |
| Investor Relations URL | https://investors.mpmaterials.com/ |
| HQ State/Province | Nevada |
| Sector | Materials |
| Industry | Metals & Mining |
| Equity Style | Small Cap Growth |
| Next Earnings Release | Aug. 06, 2026 |
| Last Earnings Release | May. 07, 2026 |
| Next Ex-Dividend Date | N/A |
| Last Ex-Dividend Date | N/A |