

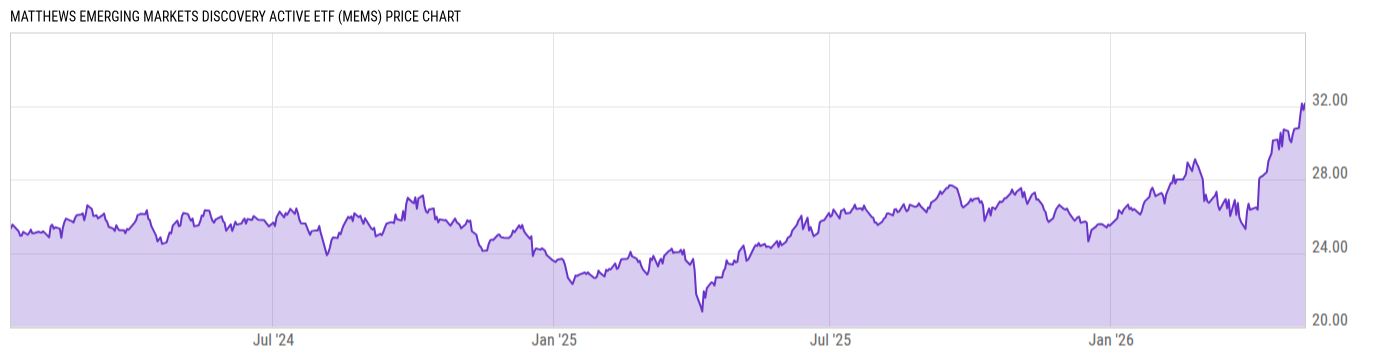
Matthews Emerging Markets Discovery Active ETF (MEMS)
30.09
-0.01
(-0.04%)
USD |
NASDAQ |
Jun 08, 16:00
Price Chart
Key Stats
| Net Expense Ratio | Discount or Premium to NAV | Total Assets Under Management | 30-Day Average Daily Volume |
|---|---|---|---|
| 0.89% | 0.30% | 21.60M | 1787.63 |
| Weighted Average Dividend Yield | Turnover Ratio (Generic) | 1 Year Fund Level Flows | Max Drawdown (Since Inception) |
| 1.10% | 42.00% | -523640.0 |
Basic Info
| Investment Strategy | |
| The Fund seeks long-term capital appreciation. Under normal circumstances, the Matthews Emerging Markets Discovery Active ETF seeks to achieve its investment objective by investing at least 65% of its net assets, which include borrowings for investment purposes, in the common and preferred stocks of Small Companies. |
| General | |
| Security Type | Exchange-Traded Fund |
| Equity Style | Multi Cap Growth |
| Broad Asset Class | International Equity |
| Broad Category | Equity |
| Global Peer Group | Equity Emerging Markets Global |
| Peer Group | Emerging Markets Funds |
| Global Macro | Equity Emerging Markets |
| US Macro | Emerging Markets Equity Funds |
| YCharts Categorization | -- |
| YCharts Benchmark | -- |
| Prospectus Objective | Emerging Markets Funds |
| Fund Owner Firm Name | Matthews Asia |
| Broad Asset Class Benchmark Index | |
| ^MSACXUSNTR | 100.0% |
Performance Versus Peer Group
Annual Total Returns Versus Peers
As of June 09, 2026.
Asset Allocation
As of May 31, 2026.
| Type | % Net |
|---|---|
| Cash | 4.59% |
| Stock | 91.24% |
| Bond | 4.64% |
| Convertible | 0.00% |
| Preferred | 0.00% |
| Other | -0.47% |
Basic Info
| Investment Strategy | |
| The Fund seeks long-term capital appreciation. Under normal circumstances, the Matthews Emerging Markets Discovery Active ETF seeks to achieve its investment objective by investing at least 65% of its net assets, which include borrowings for investment purposes, in the common and preferred stocks of Small Companies. |
| General | |
| Security Type | Exchange-Traded Fund |
| Equity Style | Multi Cap Growth |
| Broad Asset Class | International Equity |
| Broad Category | Equity |
| Global Peer Group | Equity Emerging Markets Global |
| Peer Group | Emerging Markets Funds |
| Global Macro | Equity Emerging Markets |
| US Macro | Emerging Markets Equity Funds |
| YCharts Categorization | -- |
| YCharts Benchmark | -- |
| Prospectus Objective | Emerging Markets Funds |
| Fund Owner Firm Name | Matthews Asia |
| Broad Asset Class Benchmark Index | |
| ^MSACXUSNTR | 100.0% |