

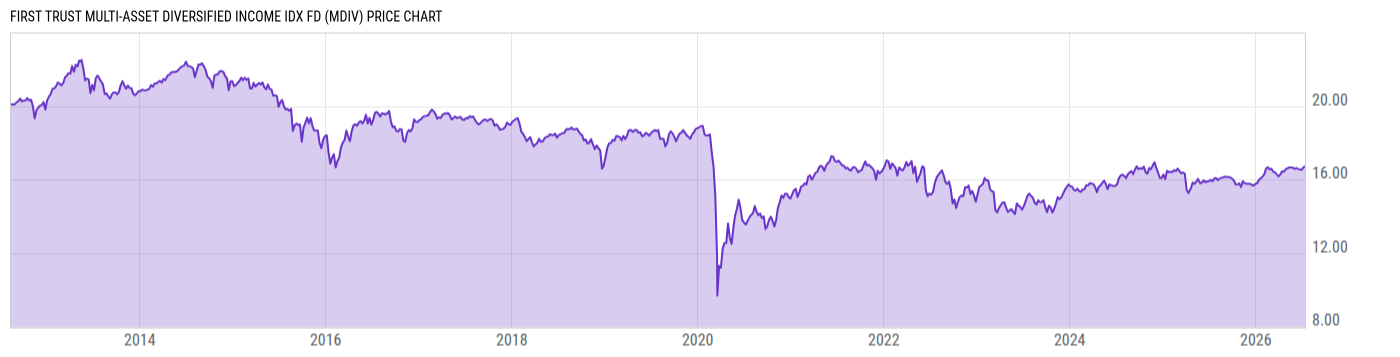
First Trust Multi-Asset Diversified Income Idx Fd (MDIV)
16.70
+0.04
(+0.23%)
USD |
NASDAQ |
Jul 13, 16:00
16.70
0.00 (0.00%)
After-Hours: 17:16
Price Chart
Key Stats
| Net Expense Ratio | Discount or Premium to NAV | Total Assets Under Management | 30-Day Average Daily Volume |
|---|---|---|---|
| 0.71% | 0.07% | 424.54M | 71105.33 |
| Weighted Average Dividend Yield | Turnover Ratio (Generic) | 1 Year Fund Level Flows | Max Drawdown (Since Inception) |
| 6.52% | 68.00% | -75.23M |
Basic Info
| Investment Strategy | |
| The Fund seeks investment results that correspond generally to the price and yield of an index called the NASDAQ Multi-Asset Diversified Income Index. The Index is designed to provide access to a diversified portfolio of small, mid and large capitalization income producing securities. |
| General | |
| Security Type | Exchange-Traded Fund |
| Equity Style | Mid Cap Value |
| Broad Asset Class | Allocation |
| Broad Category | Allocation |
| Global Peer Group | Mixed Asset USD Flexible - US |
| Peer Group | Flexible Portfolio Funds |
| Global Macro | Mixed Asset HC Flexible |
| US Macro | Mixed-Assets Funds |
| YCharts Categorization | -- |
| YCharts Benchmark | -- |
| Prospectus Objective | Flexible Portfolio Funds |
| Fund Owner Firm Name | First Trust |
| Broad Asset Class Benchmark Index | |
| ^SPXTR | 100.0% |
Performance Versus Peer Group
Annual Total Returns Versus Peers
As of July 13, 2026.
Asset Allocation
As of June 30, 2026.
| Type | % Net |
|---|---|
| Cash | 0.86% |
| Stock | 46.08% |
| Bond | 21.03% |
| Convertible | 0.00% |
| Preferred | 12.68% |
| Other | 19.35% |
Basic Info
| Investment Strategy | |
| The Fund seeks investment results that correspond generally to the price and yield of an index called the NASDAQ Multi-Asset Diversified Income Index. The Index is designed to provide access to a diversified portfolio of small, mid and large capitalization income producing securities. |
| General | |
| Security Type | Exchange-Traded Fund |
| Equity Style | Mid Cap Value |
| Broad Asset Class | Allocation |
| Broad Category | Allocation |
| Global Peer Group | Mixed Asset USD Flexible - US |
| Peer Group | Flexible Portfolio Funds |
| Global Macro | Mixed Asset HC Flexible |
| US Macro | Mixed-Assets Funds |
| YCharts Categorization | -- |
| YCharts Benchmark | -- |
| Prospectus Objective | Flexible Portfolio Funds |
| Fund Owner Firm Name | First Trust |
| Broad Asset Class Benchmark Index | |
| ^SPXTR | 100.0% |