Macquarie Group Ltd. (MCQEF)
Financials
With YCharts’ financial data, you can comprehensively analyze companies’ Income Statements, Cash Flow Dynamics, and Balance Sheets. Harness these vital insights to unveil profitability trends, understand financial health, and confidently guide your data-driven investment decisions.

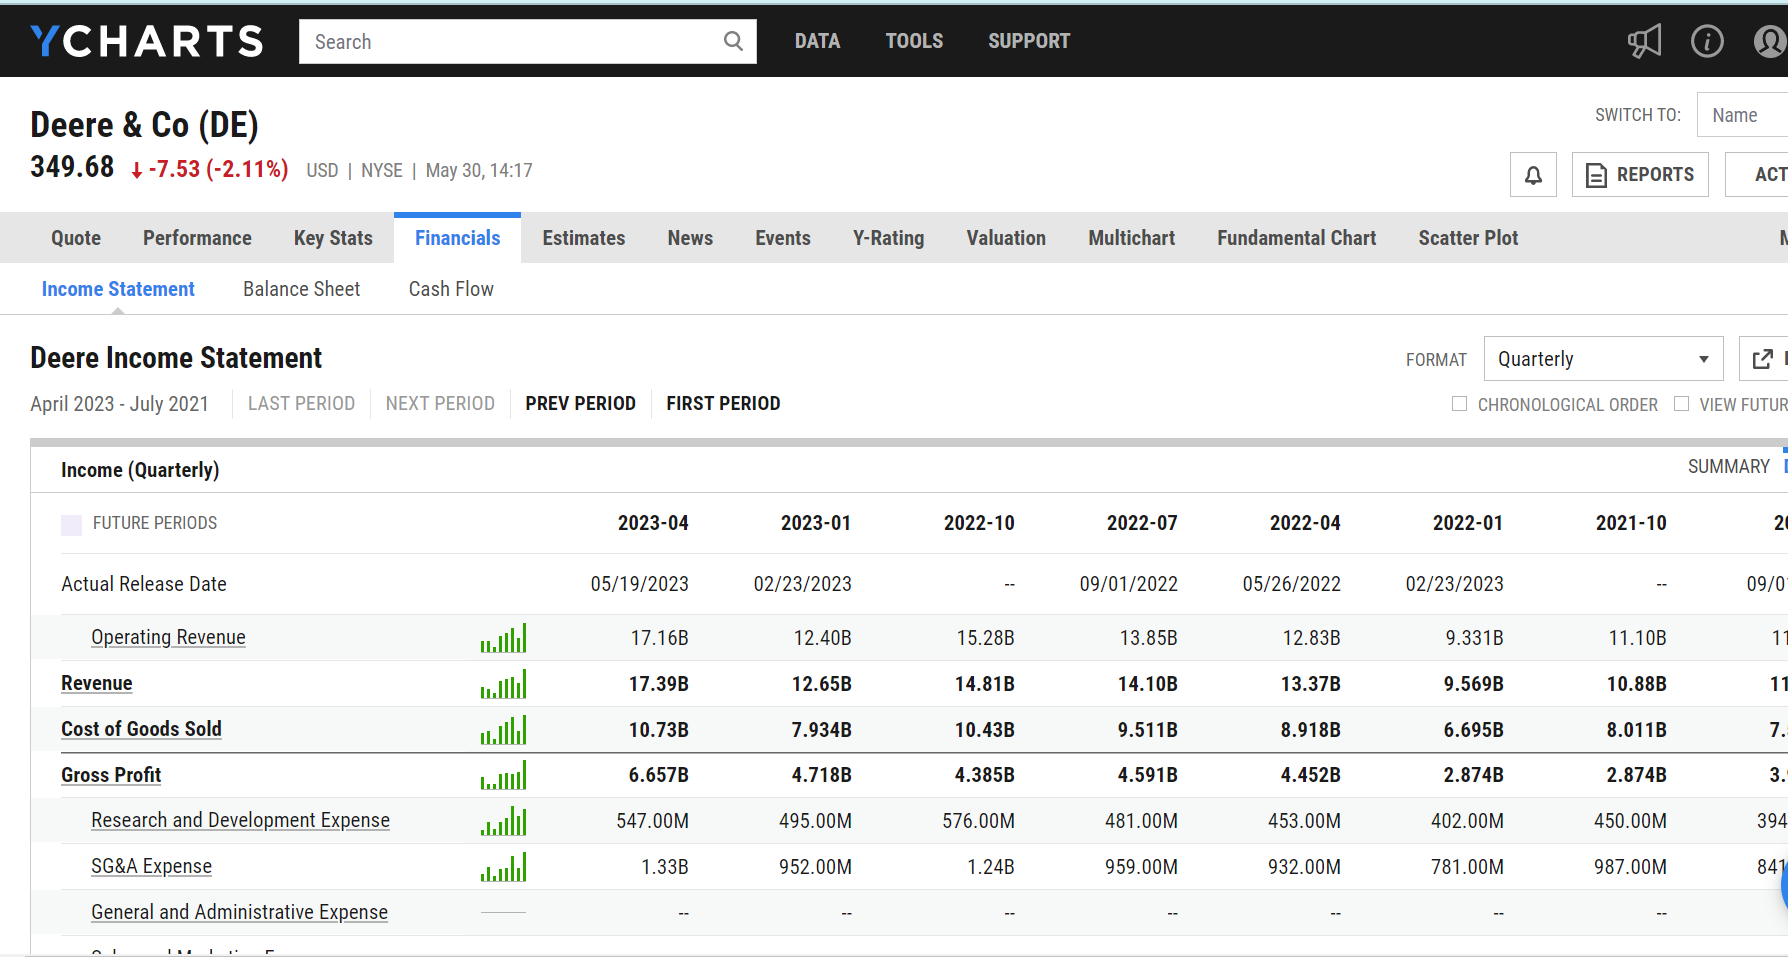
Income Statement Insights
Delve into the heart of profitability with current and historical income statements. Analyze critical components such as revenue, cost of goods sold, and net income. Uncover and use profitability trends to make data-driven investment decisions.
Decode Cash Flow Dynamics
Navigate the financial pulse of companies by examining detailed cash flow statements. Track cash generation and expenditure from operating activities like sales and purchases, investing activities such as acquisitions or disposals, and financing activities including dividends and share buybacks. You can use this data to grasp a company's financial health, paving the way for insightful investment decisions.
Uncover Financial Health with Balance Sheets
Delve into a company's financial position by exploring its balance sheet. Gain insights into the company's tangible and intangible assets, its liabilities, including loans and accounts payable, and shareholders' equity. With this information, gauge risk, estimate valuation, and let balance sheet revelations guide your investment decisions.
QUESTIONS?
- Email: support@ycharts.com
- Call: (866) 965-7552
READY TO GET STARTED?
Unlock My AccessAccess Financials Now
Unlock access to Financials by registering below. No credit card required.
Unlock My AccessQUESTIONS?
- Email: support@ycharts.com
- Call: (866) 965-7552