

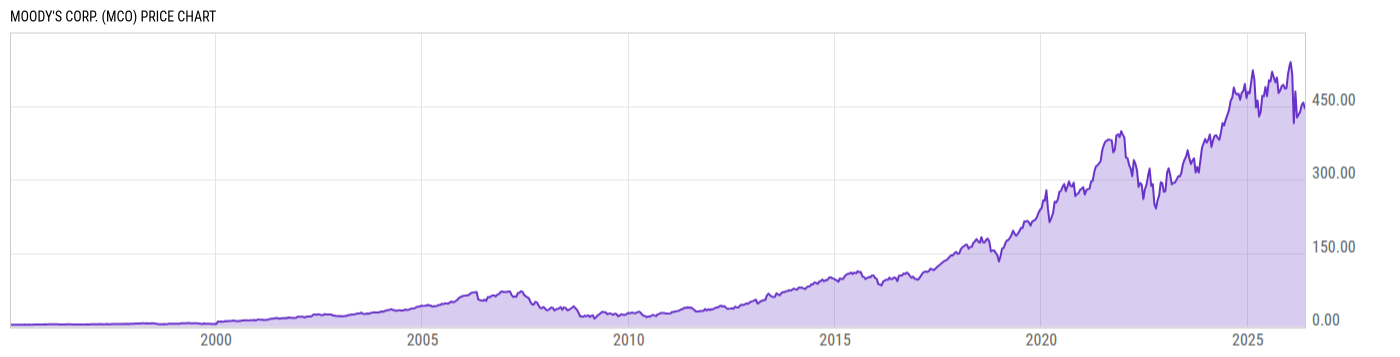
Moody's Corp. (MCO)
449.79
+6.03
(+1.36%)
USD |
NYSE |
Jun 09, 16:00
449.79
0.00 (0.00%)
After-Hours: 19:12
Price Chart
Key Stats
| Price and Performance | |
|---|---|
| Market Cap | 78.57B |
| 52 Week High (Daily) | |
| 52 Week Low (Daily) | |
| All-Time High (Daily) | |
| Year to Date Total Returns (Daily) | |
| 1 Month Total Returns (Daily) | |
| 1 Year Total Returns (Daily) | -8.48% |
| Valuation | |
| PE Ratio | 32.25 |
| PE Ratio (Forward) | |
| PS Ratio | 10.22 |
| Price to Book Value | 26.24 |
| EV to EBITDA | |
| Dividend | |
|---|---|
| Dividend | 1.03 |
| Dividend Yield (Forward) | |
| Financials | |
| Revenue (5 Year Growth) | |
| Revenue (Quarterly YoY Growth) | |
| EPS Diluted (5 Year Growth) | |
| EPS Diluted (Quarterly YoY Growth) | |
| Debt to Equity Ratio | 2.443 |
| Return on Equity | |
| Return on Assets | |
| Risk | |
| Beta (5Y) | |
| Max Drawdown (5Y) | 41.66% |
Profile
| Moody's Corp. engages in the provision of credit ratings, research, tools and analysis to the global capital markets. It operates through the Moody's Investors Service (MIS) and Moody's Analytics (MA) segments. The MIS segment is a credit rating agency, which publishes credit ratings on debt obligations and the entities, including various corporate and governmental obligations, structured finance securities, and commercial paper programs. The MA segment develops products and services, which support financial analysis and risk management activities of institutional participants in global financial markets. The company was founded by John Moody in 1909 and is headquartered in New York, NY. |
| URL | http://www.moodys.com |
| Investor Relations URL | https://ir.moodys.com/ |
| HQ State/Province | New York |
| Sector | Financials |
| Industry | Capital Markets |
| Next Earnings Release | Jul. 23, 2026 (est.) |
| Last Earnings Release | Apr. 22, 2026 |
| Next Ex-Dividend Date | N/A |
| Last Ex-Dividend Date | May. 15, 2026 |