

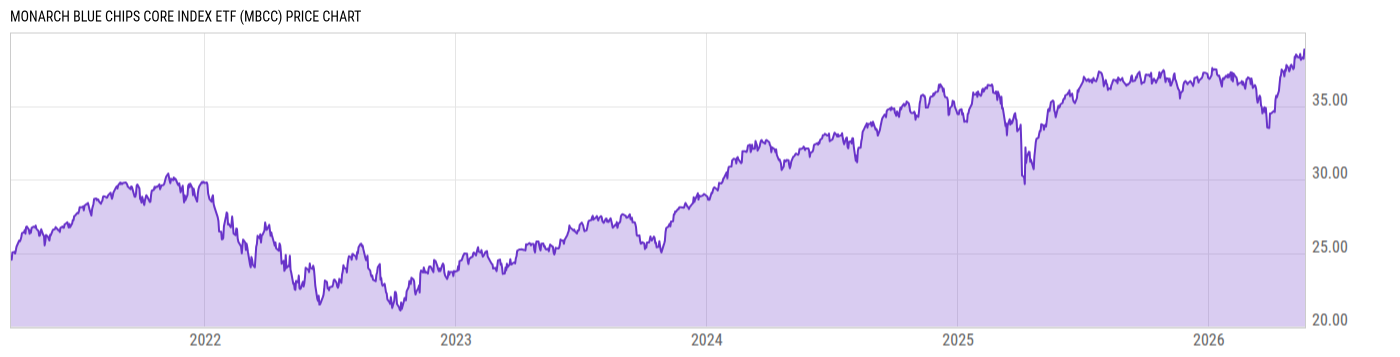
Monarch Blue Chips Core Index ETF (MBCC)
38.67
+0.45
(+1.18%)
USD |
BATS |
May 20, 16:00
38.67
0.00 (0.00%)
After-Hours: 20:00
Price Chart
Key Stats
| Net Expense Ratio | Discount or Premium to NAV | Total Assets Under Management | 30-Day Average Daily Volume |
|---|---|---|---|
| 0.98% | -0.11% | 173.11M | 13552.60 |
| Weighted Average Dividend Yield | Turnover Ratio (Generic) | 1 Year Fund Level Flows | Max Drawdown (Since Inception) |
| 0.95% | 75.00% | -3.856M |
Basic Info
| Investment Strategy | |
| The Fund seeks to replicate investment results that generally correspond to the performance of the Monarch Blue Chips Core Index, which consists of established, well-recognized companies listed on the S&P 500 from a broad range of industries that demonstrate strength in the marketplace based on fundamental company data. |
| General | |
| Security Type | Exchange-Traded Fund |
| Equity Style | Large Cap Core |
| Broad Asset Class | US Equity |
| Broad Category | Equity |
| Global Peer Group | Equity US |
| Peer Group | Large-Cap Core Funds |
| Global Macro | Equity North America |
| US Macro | Large-Cap Funds |
| YCharts Categorization | -- |
| YCharts Benchmark | -- |
| Prospectus Objective | Growth & Income Funds |
| Fund Owner Firm Name | Monarch Funds |
| Broad Asset Class Benchmark Index | |
| ^SPXTR | 100.0% |
Performance Versus Peer Group
Annual Total Returns Versus Peers
As of May 21, 2026.
Asset Allocation
As of April 30, 2026.
| Type | % Net |
|---|---|
| Cash | 0.14% |
| Stock | 99.93% |
| Bond | 0.00% |
| Convertible | 0.00% |
| Preferred | 0.00% |
| Other | -0.07% |
Basic Info
| Investment Strategy | |
| The Fund seeks to replicate investment results that generally correspond to the performance of the Monarch Blue Chips Core Index, which consists of established, well-recognized companies listed on the S&P 500 from a broad range of industries that demonstrate strength in the marketplace based on fundamental company data. |
| General | |
| Security Type | Exchange-Traded Fund |
| Equity Style | Large Cap Core |
| Broad Asset Class | US Equity |
| Broad Category | Equity |
| Global Peer Group | Equity US |
| Peer Group | Large-Cap Core Funds |
| Global Macro | Equity North America |
| US Macro | Large-Cap Funds |
| YCharts Categorization | -- |
| YCharts Benchmark | -- |
| Prospectus Objective | Growth & Income Funds |
| Fund Owner Firm Name | Monarch Funds |
| Broad Asset Class Benchmark Index | |
| ^SPXTR | 100.0% |