

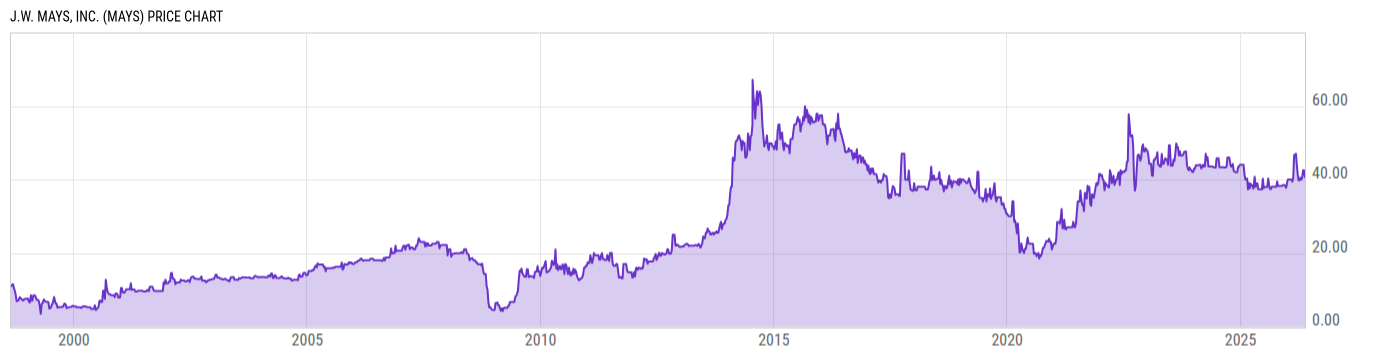
J.W. Mays, Inc. (MAYS)
42.54
0.00 (0.00%)
USD |
NASDAQ |
May 15, 16:00
Price Chart
Key Stats
| Price and Performance | |
|---|---|
| Market Cap | 85.75M |
| 52 Week High (Daily) | |
| 52 Week Low (Daily) | |
| All-Time High (Daily) | |
| Year to Date Total Returns (Daily) | |
| 1 Month Total Returns (Daily) | |
| 1 Year Total Returns (Daily) | 13.29% |
| Valuation | |
| PE Ratio | -- |
| PE Ratio (Forward) | |
| PS Ratio | 3.943 |
| Price to Book Value | 1.652 |
| EV to EBITDA | |
| Dividend | |
|---|---|
| Dividend | -- |
| Dividend Yield (Forward) | |
| Financials | |
| Revenue (5 Year Growth) | |
| Revenue (Quarterly YoY Growth) | |
| EPS Diluted (5 Year Growth) | |
| EPS Diluted (Quarterly YoY Growth) | |
| Debt to Equity Ratio | 0.5419 |
| Return on Equity | |
| Return on Assets | |
| Risk | |
| Beta (5Y) | |
| Max Drawdown (5Y) | 55.24% |
Profile
| J.W. Mays, Inc. engages in the operation of commercial real estate properties. The company was founded in 1924 and is headquartered in Brooklyn, NY. |
| URL | http://www.jwmays.com |
| Investor Relations URL | N/A |
| HQ State/Province | New York |
| Sector | Real Estate |
| Industry | Real Estate Management & Development |
| Next Earnings Release | N/A |
| Last Earnings Release | N/A |
| Next Ex-Dividend Date | N/A |
| Last Ex-Dividend Date | N/A |