

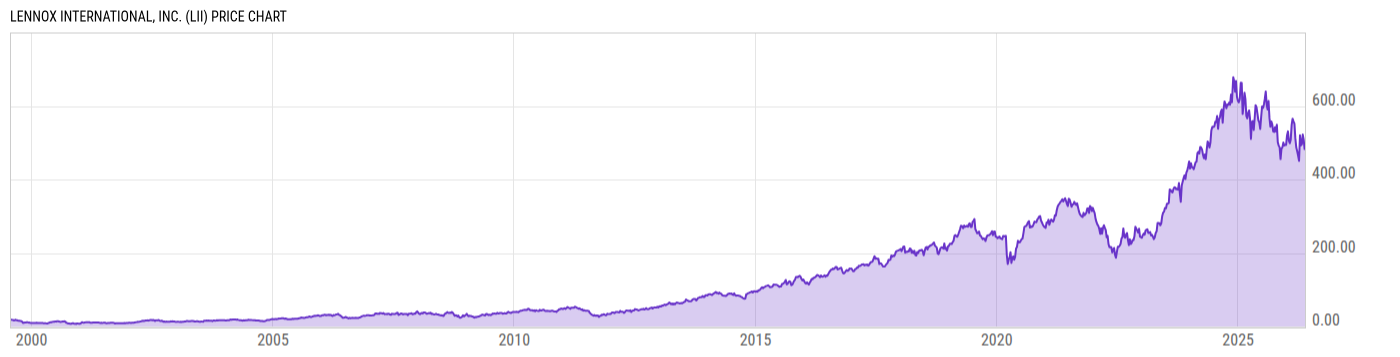
Lennox International, Inc. (LII)
513.50
+5.06
(+1.00%)
USD |
NYSE |
Jun 08, 16:00
513.35
-0.14
(-0.03%)
After-Hours: 20:00
Price Chart
Key Stats
| Price and Performance | |
|---|---|
| Market Cap | 17.87B |
| 52 Week High (Daily) | |
| 52 Week Low (Daily) | |
| All-Time High (Daily) | |
| Year to Date Total Returns (Daily) | |
| 1 Month Total Returns (Daily) | |
| 1 Year Total Returns (Daily) | -6.72% |
| Valuation | |
| PE Ratio | 23.12 |
| PE Ratio (Forward) | |
| PS Ratio | 3.438 |
| Price to Book Value | 14.73 |
| EV to EBITDA | |
| Dividend | |
|---|---|
| Dividend | 1.36 |
| Dividend Yield (Forward) | |
| Financials | |
| Revenue (5 Year Growth) | |
| Revenue (Quarterly YoY Growth) | |
| EPS Diluted (5 Year Growth) | |
| EPS Diluted (Quarterly YoY Growth) | |
| Debt to Equity Ratio | 1.610 |
| Return on Equity | |
| Return on Assets | |
| Risk | |
| Beta (5Y) | |
| Max Drawdown (5Y) | 46.87% |
Profile
| Lennox International, Inc. engages in the design, manufacture, and marketing of products for heating, ventilation, air conditioning, and refrigeration. It operates through the following segments: Home Comfort Solutions, Building Climate Solutions, and Corporate and Other. The Home Comfort Solutions segment is involved in furnaces, air conditioners, heat pumps, packaged heating and cooling systems, indoor air quality equipment, comfort control products, replacement parts, and supplies. The Building Climate Solutions segment consists of unitary heating and air conditioning equipment, applied systems, controls, installation and service of commercial heating and cooling equipment, variable refrigerant flow commercial products, curb, curb adapters, drop box diffusers, HVAC recycling and salvage service, condensing units, unit coolers, fluid coolers, air cooled condensers, air handlers, process chillers, controls, and compressor racks. The Corporate and Other segment refers to the unitary heating and air conditioning equipment, chillers, air handlers, fan coils, fluid coolers, and compressor racks. The company was founded by Dave Lennox in 1895 and is headquartered in Richardson, TX. |
| URL | http://www.lennox.com |
| Investor Relations URL | https://investor.lennox.com/ |
| HQ State/Province | Texas |
| Sector | Industrials |
| Industry | Building Products |
| Next Earnings Release | Jul. 29, 2026 (est.) |
| Last Earnings Release | Apr. 29, 2026 |
| Next Ex-Dividend Date | Jun. 30, 2026 |
| Last Ex-Dividend Date | Mar. 31, 2026 |