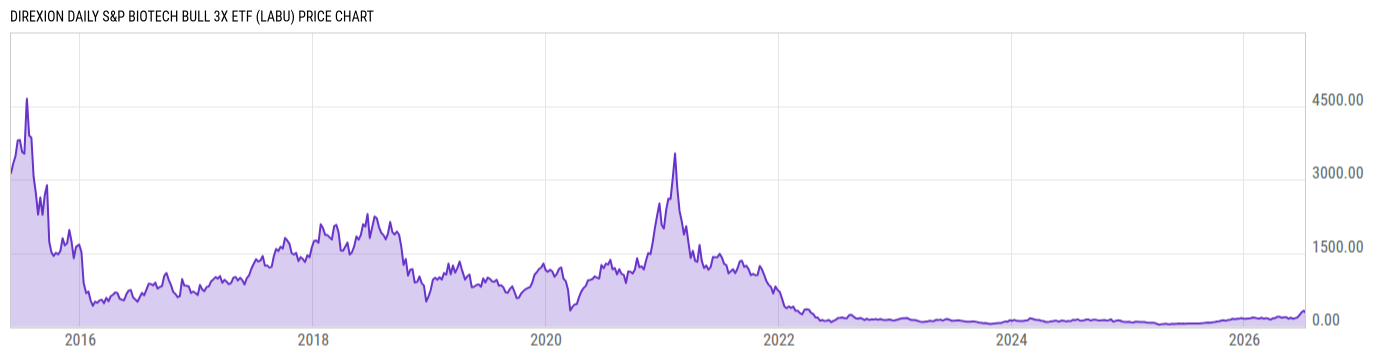
Direxion Daily S&P Biotech Bull 3X ETF (LABU)
4.57
+0.05
(+1.11%)
USD |
NYSEARCA |
Mar 24, 16:00
4.57
0.00 (0.00%)
After-Hours: 20:00
Key Stats
Expense Ratio | Discount or Premium to NAV | Total Assets Under Management | 30-Day Average Daily Volume |
---|---|---|---|
1.01% | -0.13% | 841.45M | 44.35M |
Dividend Yield | Turnover Ratio | 1 Year Fund Level Flows | Max Drawdown (All) |
0.00% | 148.0% | 505.11M | Upgrade |
Basic Info
Investment Strategy | |
The investment seeks daily investment results, before fees and expenses, of 300% of the daily performance of the S&P Biotechnology Select Industry Index ("index"). The fund invests at least 80% of its net assets (plus borrowing for investment purposes) in financial instruments and securities of the index, exchange-traded funds ("ETFs") that track the index and other financial instruments that provide daily leveraged exposure to the index or ETFs that track the index. The index is designed to measure the performance of the biotechnology sub-industry based on the Global Industry Classification Standards ("GICS"). The fund is non-diversified. |
General | |
Security Type | Exchange-Traded Fund |
Equity Style | Small Cap/Growth |
Fixed Income Style | -- |
Broad Asset Class | Miscellaneous |
Broad Category | Miscellaneous |
Category Name | Trading--Leveraged Equity |
Category Index | S&P 500 TR USD |
Global Category Name | Trading Tools |
YCharts Categorization | Other |
YCharts Benchmark | S&P 500 Total Return (^SPXTR) |
Prospectus Objective | Specialty - Technology |
Fund Owner Firm Name | Direxion Funds |
Prospectus Benchmark Index | |
S&P Biotechnology Select Industry TR USD | 300.0% |
Broad Asset Class Benchmark Index | |
^SPXTR | 100.0% |
Manager Tenure | |
Paul Brigandi | 7.76 yrs |
Tony Ng | 7.42 yrs |
Net Fund Flows Versus Category
1 Month
% Rank:
--
--
Category Low
--
Category High
1 Year
% Rank:
3
505.11M
-474.20M
Category Low
4.729B
Category High
3 Months
% Rank:
--
--
Category Low
--
Category High
3 Years
% Rank:
--
--
Category Low
--
Category High
6 Months
% Rank:
--
--
Category Low
--
Category High
5 Years
% Rank:
--
--
Category Low
--
Category High
YTD
% Rank:
--
--
Category Low
--
Category High
10 Years
% Rank:
--
--
Category Low
--
Category High
As of February 28, 2023
Risk
Performance Versus Category
As of March 24, 2023. Returns for periods of 1 year and above are annualized.
Annual Total Returns Versus Peers
As of March 24, 2023.
Asset Allocation
Top 10 Holdings
Name | % Weight | Price | % Change |
---|---|---|---|
Dreyfus Government Secs Cash Mgmt Admin | 19.73% | 1.00 | 0.00% |
Goldman Sachs Sterling FixInc Port Inc
|
5.27% | -- | -- |
Goldman Finl Sq Trsry Ins
|
2.44% | -- | -- |
Goldman Fs Govt Inst
|
2.35% | -- | -- |
Goldman Finl Sq Trsry Ins
|
1.55% | -- | -- |
Seagen Inc Ordinary Shares | 0.89% | 197.64 | -0.23% |
IVERIC bio Inc | 0.86% | 24.17 | 1.94% |
Exelixis Inc | 0.86% | 18.48 | 0.82% |
Catalyst Pharmaceuticals Inc | 0.85% | 16.12 | 0.62% |
Moderna Inc | 0.84% | 150.88 | 0.98% |
News
Headline
Wire
Time (ET)
Basic Info
Investment Strategy | |
The investment seeks daily investment results, before fees and expenses, of 300% of the daily performance of the S&P Biotechnology Select Industry Index ("index"). The fund invests at least 80% of its net assets (plus borrowing for investment purposes) in financial instruments and securities of the index, exchange-traded funds ("ETFs") that track the index and other financial instruments that provide daily leveraged exposure to the index or ETFs that track the index. The index is designed to measure the performance of the biotechnology sub-industry based on the Global Industry Classification Standards ("GICS"). The fund is non-diversified. |
General | |
Security Type | Exchange-Traded Fund |
Equity Style | Small Cap/Growth |
Fixed Income Style | -- |
Broad Asset Class | Miscellaneous |
Broad Category | Miscellaneous |
Category Name | Trading--Leveraged Equity |
Category Index | S&P 500 TR USD |
Global Category Name | Trading Tools |
YCharts Categorization | Other |
YCharts Benchmark | S&P 500 Total Return (^SPXTR) |
Prospectus Objective | Specialty - Technology |
Fund Owner Firm Name | Direxion Funds |
Prospectus Benchmark Index | |
S&P Biotechnology Select Industry TR USD | 300.0% |
Broad Asset Class Benchmark Index | |
^SPXTR | 100.0% |
Manager Tenure | |
Paul Brigandi | 7.76 yrs |
Tony Ng | 7.42 yrs |
Fundamentals
General | |
Distribution Yield | Upgrade |
Dividend Yield TTM (3-24-23) | 0.00% |
30-Day SEC Yield | -- |
7-Day SEC Yield | -- |
Number of Holdings | Upgrade |
Stock | |
Weighted Average PE Ratio | -- |
Weighted Average Price to Sales Ratio | Upgrade |
Weighted Average Price to Book Ratio | Upgrade |
Weighted Median ROE | Upgrade |
Weighted Median ROA | Upgrade |
Forecasted Dividend Yield | Upgrade |
Forecasted PE Ratio | Upgrade |
Forecasted Price to Sales Ratio | Upgrade |
Forecasted Price to Book Ratio | Upgrade |
As of March 23, 2023
Fund Details
Key Dates | |
Inception Date | 5/28/2015 |
Last Annual Report Date | 10/31/2022 |
Last Prospectus Date | 2/28/2023 |
Attributes | |
Index Fund |
|
Inverse Fund | No |
Leveraged Fund |
|
Fund of Funds | No |
Currency Hedged Fund | No |
Synthetic Replication Fund | No |
Has Dividend Investment Plan | No |
Socially Responsible Fund | No |
News
Headline
Wire
Time (ET)