

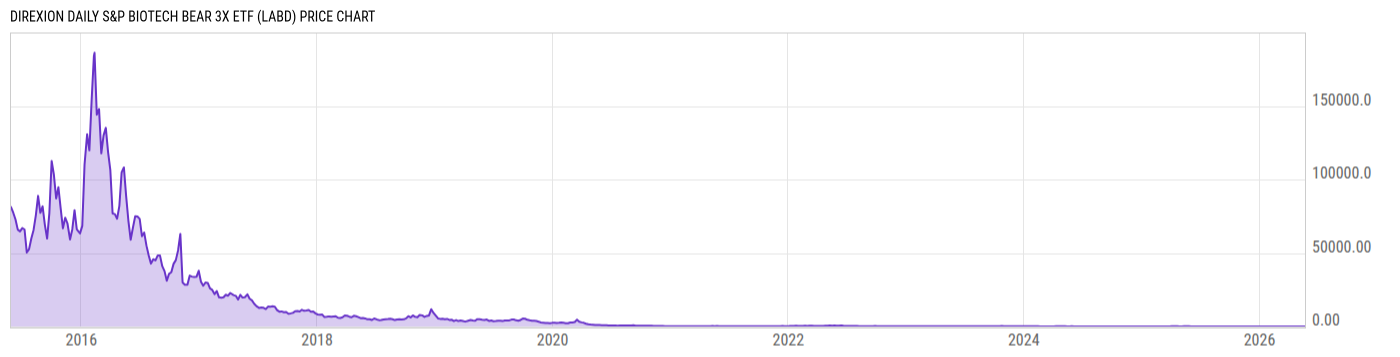
Direxion Daily S&P Biotech Bear 3X ETF (LABD)
14.31
+0.37
(+2.65%)
USD |
NYSEARCA |
May 22, 16:00
14.31
0.00 (0.00%)
After-Hours: 20:00
Price Chart
Key Stats
| Net Expense Ratio | Discount or Premium to NAV | Total Assets Under Management | 30-Day Average Daily Volume |
|---|---|---|---|
| 1.07% | 0.15% | 76.53M | 5.162M |
| Weighted Average Dividend Yield | Turnover Ratio (Generic) | 1 Year Fund Level Flows | Max Drawdown (Since Inception) |
| -- | 0.00% | 126.86M |
Basic Info
| Investment Strategy | |
| The Fund seeks daily investment results, before fees and expenses, of 300% of the inverse of the performance of the S&P Biotechnology Select Industry Index. The Fund creates short positions by investing at least 80% of its assets in: swap agreements; options on securities and indices; forward contracts. |
| General | |
| Security Type | Exchange-Traded Fund |
| Equity Style | -- |
| Broad Asset Class | Alternative |
| Broad Category | Alternative Strategies |
| Global Peer Group | Alternative Dedicated Short Bias |
| Peer Group | Dedicated Short Bias Funds |
| Global Macro | Liquid Alternatives |
| US Macro | Alternative Equity Funds |
| YCharts Categorization | -- |
| YCharts Benchmark | -- |
| Prospectus Objective | Dedicated Short Bias Funds |
| Fund Owner Firm Name | Direxion |
| Broad Asset Class Benchmark Index | |
| ^MSACWINTR | 100.0% |
Performance Versus Peer Group
Annual Total Returns Versus Peers
As of May 24, 2026.
Asset Allocation
As of April 30, 2026.
| Type | % Net |
|---|---|
| Cash | 29.79% |
| Stock | 0.00% |
| Bond | 80.36% |
| Convertible | 0.00% |
| Preferred | 0.00% |
| Other | -10.14% |
Basic Info
| Investment Strategy | |
| The Fund seeks daily investment results, before fees and expenses, of 300% of the inverse of the performance of the S&P Biotechnology Select Industry Index. The Fund creates short positions by investing at least 80% of its assets in: swap agreements; options on securities and indices; forward contracts. |
| General | |
| Security Type | Exchange-Traded Fund |
| Equity Style | -- |
| Broad Asset Class | Alternative |
| Broad Category | Alternative Strategies |
| Global Peer Group | Alternative Dedicated Short Bias |
| Peer Group | Dedicated Short Bias Funds |
| Global Macro | Liquid Alternatives |
| US Macro | Alternative Equity Funds |
| YCharts Categorization | -- |
| YCharts Benchmark | -- |
| Prospectus Objective | Dedicated Short Bias Funds |
| Fund Owner Firm Name | Direxion |
| Broad Asset Class Benchmark Index | |
| ^MSACWINTR | 100.0% |