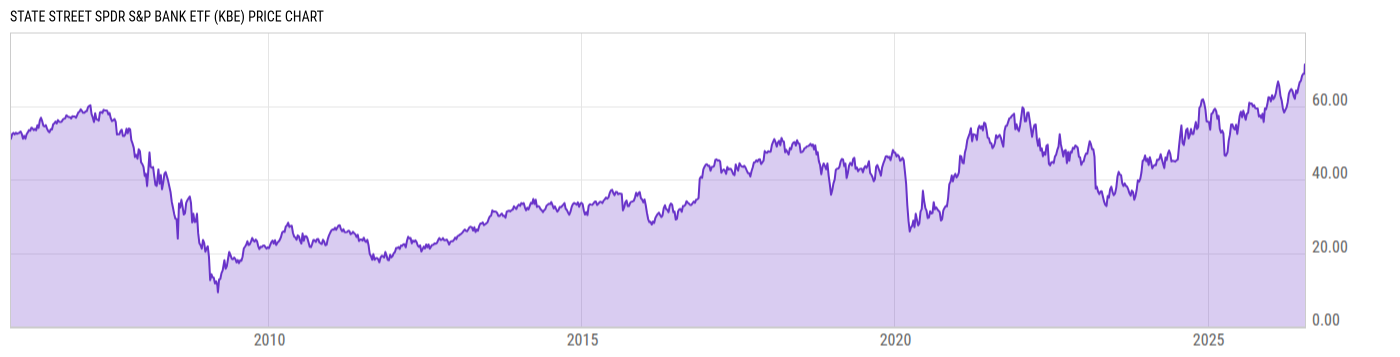
SPDR® S&P Bank ETF (KBE)
46.80
+0.75 +1.63%
NYSE Arca
Dec 6, 10:03
Delayed 2m
USD
Key Stats
Expense Ratio | 0.35% |
Total Assets Under Management | 1.769B |
Share Class Assets Under Management | 1.769B |
30-Day Average Daily Volume | 1.401M |
Net Asset Value | 46.02 |
Discount or Premium to NAV | -0.01% |
Turnover Ratio | 24.00% |
1 Year Fund Level Flows | -1.257B |
View All KBE News
News
-
WireHeadlineTime (ET)
-
SA Breaking News11/18 15:31
-
SA Breaking News10/17 16:12
-
SA Breaking News10/10 15:56
-
SA Breaking News10/10 11:05
-
SA Breaking News10/08 16:56
-
SA Breaking News09/20 11:11
-
SA Breaking News09/12 13:26
-
SA Breaking News09/05 13:16
-
SA Breaking News09/05 12:11
-
SA Breaking News08/27 13:53
Performance & Returns
Total Return (Price) | Total Return (NAV) | Cat. Total Return (NAV) | % Rank in Cat. (NAV) | |
---|---|---|---|---|
1M | -0.43% | -0.43% | 0.81% | 83 |
3M | 11.56% | 11.54% | 8.89% | 11 |
6M | 9.33% | 9.21% | 8.25% | 61 |
YTD | 25.50% | 25.44% | 24.23% | 53 |
1Y | 12.52% | 12.41% | 14.57% | 66 |
3Y | 4.88% | 4.84% | 8.70% | 86 |
5Y | 8.33% | 8.31% | 8.39% | 56 |
10Y | 9.42% | 9.43% | 10.35% | 70 |
15Y | -- | -- | 4.40% | -- |
20Y | -- | -- | 6.30% | -- |
Asset Allocation
Type | % Net | % Long | % Short |
---|---|---|---|
Cash | 0.16% | 0.16% | 0.00% |
Stock | 99.84% | 99.84% | 0.00% |
Bond | 0.00% | 0.00% | 0.00% |
Convertible | 0.00% | 0.00% | 0.00% |
Preferred | 0.00% | 0.00% | 0.00% |
Other | 0.00% | 0.00% | 0.00% |
Region Exposure
Americas | 100.0% |
North America | 98.26% |
Latin America | 1.74% |
Greater Europe | 0.00% |
United Kingdom | 0.00% |
Europe Developed | 0.00% |
Europe Emerging | 0.00% |
Africa/Middle East | 0.00% |
Greater Asia | 0.00% |
Japan | 0.00% |
Australasia | 0.00% |
Asia Developed | 0.00% |
Asia Emerging | 0.00% |
Market Classification | |
% Developed Markets | 100.0% |
% Emerging Markets | 0.00% |
Stock Sector Exposure
Basic Materials | 0.00% |
Communication Services | 0.00% |
Consumer Cyclical | 0.00% |
Consumer Defensive | 0.00% |
Energy | 0.00% |
Financial Services | 100.0% |
Healthcare | 0.00% |
Industrials | 0.00% |
Real Estate | 0.00% |
Technology | 0.00% |
Utilities | 0.00% |
Stock Market Capitalization
Giant | 7.19% |
Large | 14.95% |
Medium | 51.64% |
Small | 26.22% |
Micro | 0.00% |
Stock Style Exposure
Large Cap Value | 18.84% |
Large Cap Blend | 3.47% |
Large Cap Growth | 0.00% |
Mid Cap Value | 33.26% |
Mid Cap Blend | 16.40% |
Mid Cap Growth | 2.37% |
Small Cap Value | 10.57% |
Small Cap Blend | 14.16% |
Small Cap Growth | 0.94% |
View More Holdings
As of Dec. 4, 2019
Top 10 Holdings
Symbol | Name | % Weight | Price | % Chg |
---|---|---|---|---|
FRC | First Republic Bank | 1.90% | 112.78 | +1.63% |
MTG | MGIC Investment Corp | 1.82% | 14.12 | -0.21% |
JPM | JPMorgan Chase & Co | 1.82% | 135.29 | +1.68% |
TREE | LendingTree Inc | 1.82% | 357.56 | +0.87% |
BAC | Bank of America Corp | 1.82% | 33.67 | +1.75% |
ZION | Zions Bancorp NA | 1.81% | 50.14 | +1.70% |
WFC | Wells Fargo & Co | 1.80% | 53.83 | +1.13% |
PNC | PNC Financial Services Group Inc | 1.80% | 154.01 | +1.19% |
EQH | AXA Equitable Holdings Inc | 1.79% | 24.72 | +1.60% |
NTRS | Northern Trust Corp | 1.78% | 109.18 | +1.25% |
Advertisement
Basic Info
Investment Strategy | |
---|---|
The investment seeks to provide investment results that, before fees and expenses, correspond generally to the total return performance of the S&P Banks Select Industry Index. The fund generally invests substantially all, but at least 80%, of its total assets in the securities comprising the index. The index tracks the performance of publicly traded national money centers and leading regional banks. It may invest in equity securities that are not included in the index, cash and cash equivalents or money market instruments, such as repurchase agreements and money market funds. The fund is non-diversified. | |
General | |
Security Type | Exchange-Traded Fund |
Equity Style | Mid Cap/Value |
Fixed Income Style | -- |
Broad Asset Class | Sector Equity |
Broad Category | Equity |
Category Name | Financial |
Prospectus Objective | Specialty - Financial |
Fund Owner Firm Name | SPDR State Street Global Advisors |
Reports | |
One Page Report | Download |
Manager Info
Name | Tenure |
---|---|
Karl Schneider | 5.00 yrs |
Melissa Kapitulik | 1.00 yrs |
Michael Feehily | 8.01 yrs |
Net Fund Flows
1M | -2.015M |
3M | -84.47M |
6M | -308.35M |
YTD | -1.277B |
1Y | -1.257B |
3Y | -1.654B |
5Y | -1.747B |
10Y | -516.30M |
Risk Info
Beta (5Y) | 1.303 |
Max Drawdown (All) | 83.17% |
Historical Sharpe Ratio (10Y) | 0.525 |
Historical Sortino (All) | 0.1252 |
30-Day Rolling Volatility | 13.68% |
Daily Value at Risk (VaR) 1% (All) | 5.95% |
Monthly Value at Risk (VaR) 1% (All) | 25.95% |
Fundamentals
Dividend Yield TTM (12-6-19) | 2.20% |
30-Day SEC Yield (12-4-19) | 2.16% |
7-Day SEC Yield | -- |
Weighted Average PE Ratio | 12.09 |
Weighted Average Price to Sales Ratio | 3.328 |
Weighted Average Price to Book Ratio | 1.240 |
Weighted Median ROE | 11.40% |
Weighted Median ROA | 1.78% |
Forecasted Dividend Yield | 2.54% |
Forecasted PE Ratio | 11.55 |
Forecasted Price to Sales Ratio | 3.524 |
Forecasted Price to Book Ratio | 1.293 |
Number of Holdings | 91 |
Growth Estimates
Forecasted 5 Yr Earnings Growth | 8.41% |
Forecasted Book Value Growth | 6.78% |
Forecasted Cash Flow Growth | -- |
Forecasted Earnings Growth | 24.25% |
Forecasted Revenue Growth | 7.15% |
Attributes
Key Dates | |
---|---|
Inception Date | 11/8/2005 |
Termination Date | |
Last Annual Report Date | 6/30/2019 |
Last Prospectus Date | 10/31/2019 |
Attributes | |
Exchange Traded Share | Yes |
Exchange Traded Note | No |
Enhanced Index Fund | No |
Fixed Distribution Fund | No |
High-Net Worth Individual Fund | No |
Index Fund | Yes |
Inverse Fund | No |
Leveraged Fund | No |
Fund of Funds | No |
Currency Hedged Fund | No |
Synthetic Replication Fund | No |
Has Dividend Investment Plan | Yes |
Socially Responsible Fund | No |
General Availability | |
Available for Insurance Product | No |
Available for Retirement Plan | No |
Available for RRSP | No |
Advertisement