

Just Eat Takeaway.com BV (JTKWY)
4.00
-0.10
(-2.44%)
USD |
OTCM |
Jun 09, 16:00
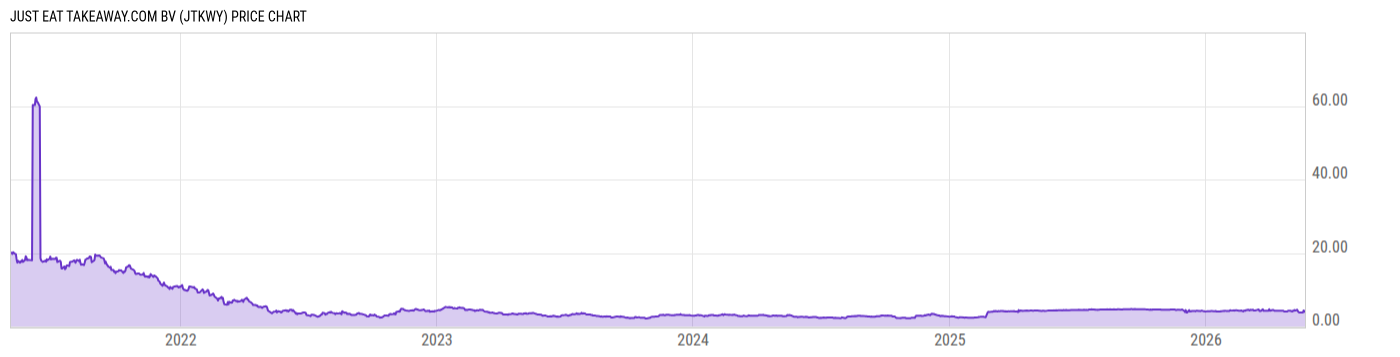
Price Chart
Key Stats
| Price and Performance | |
|---|---|
| Market Cap | -- |
| 52 Week High (Daily) | |
| 52 Week Low (Daily) | |
| All-Time High (Daily) | |
| Year to Date Total Returns (Daily) | |
| 1 Month Total Returns (Daily) | |
| 1 Year Total Returns (Daily) | -9.19% |
| Valuation | |
| PE Ratio | -- |
| PE Ratio (Forward) | |
| PS Ratio | -- |
| Price to Book Value | -- |
| EV to EBITDA | |
| Dividend | |
|---|---|
| Dividend | -- |
| Dividend Yield (Forward) | |
| Financials | |
| Revenue (5 Year Growth) | |
| Revenue (Quarterly YoY Growth) | |
| EPS Diluted (5 Year Growth) | |
| EPS Diluted (Quarterly YoY Growth) | |
| Debt to Equity Ratio | -- |
| Return on Equity | |
| Return on Assets | |
| Risk | |
| Beta (5Y) | |
| Max Drawdown (5Y) | 96.52% |
Profile
| Just Eat Takeaway.com NV engages in the online food delivery marketplace. The firm connects consumers and restaurants through its platform and also offers delivery services. It operates through the following geographical segments: North America, Northern Europe, United Kingdom and Ireland, and Southern Europe, and Australia and New Zealand. The North America segment includes the U.S. and Canada. The Northern Europe segment consists of Austria, Belgium, Denmark, Germany, Luxembourg, Norway, Poland, Switzerland, Slovakia, and the Netherlands. The Southern Europe and ANZ segment refers to Australia, Bulgaria, France, Israel, Italy, New Zealand, Portugal, Romania, and Spain. The company was founded by Jitse Groen and Laurens Groenendijk in 2000 and is headquartered in Amsterdam, the Netherlands. |
| URL | http://corporate.takeaway.com |
| Investor Relations URL | N/A |
| HQ State/Province | Noord-Holland |
| Sector | Consumer Discretionary |
| Industry | Hotels, Restaurants & Leisure |
| Next Earnings Release | N/A |
| Last Earnings Release | Feb. 23, 2026 |
| Next Ex-Dividend Date | N/A |
| Last Ex-Dividend Date | N/A |