

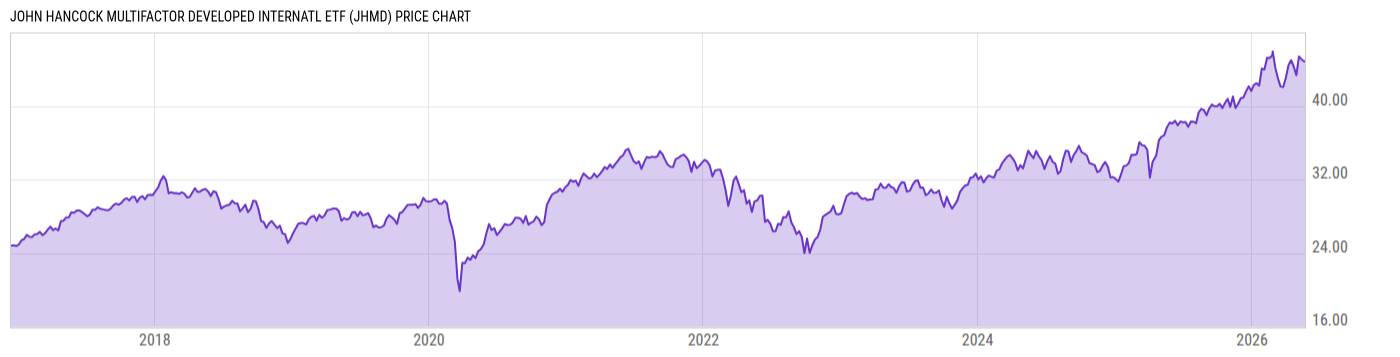
John Hancock Multifactor Developed Internatl ETF (JHMD)
43.77
-0.47
(-1.06%)
USD |
NYSEARCA |
Jun 10, 15:22
Price Chart
Key Stats
| Net Expense Ratio | Discount or Premium to NAV | Total Assets Under Management | 30-Day Average Daily Volume |
|---|---|---|---|
| 0.39% | 0.29% | 930.67M | 124068.8 |
| Weighted Average Dividend Yield | Turnover Ratio (Generic) | 1 Year Fund Level Flows | Max Drawdown (Since Inception) |
| 2.79% | 13.00% | 66.48M |
Basic Info
| Investment Strategy | |
| The Fund seeks to provide investment results that closely correspond, before fees and expenses, to the performance of the John Hancock Dimensional Developed International Index. The Index is designed to comprise a subset of securities of companies associated with developed markets outside the U.S. and Canada. |
| General | |
| Security Type | Exchange-Traded Fund |
| Equity Style | Large Cap Value |
| Broad Asset Class | International Equity |
| Broad Category | Equity |
| Global Peer Group | Equity Global ex US |
| Peer Group | International Multi-Cap Core |
| Global Macro | Equity Global |
| US Macro | Developed International Markets Funds |
| YCharts Categorization | -- |
| YCharts Benchmark | -- |
| Prospectus Objective | International Funds |
| Fund Owner Firm Name | John Hancock Group |
| Broad Asset Class Benchmark Index | |
| ^MSACXUSNTR | 100.0% |
Performance Versus Peer Group
Annual Total Returns Versus Peers
As of June 10, 2026.
Asset Allocation
As of April 30, 2026.
| Type | % Net |
|---|---|
| Cash | 3.50% |
| Stock | 98.18% |
| Bond | 0.25% |
| Convertible | 0.00% |
| Preferred | 0.55% |
| Other | -2.48% |
Basic Info
| Investment Strategy | |
| The Fund seeks to provide investment results that closely correspond, before fees and expenses, to the performance of the John Hancock Dimensional Developed International Index. The Index is designed to comprise a subset of securities of companies associated with developed markets outside the U.S. and Canada. |
| General | |
| Security Type | Exchange-Traded Fund |
| Equity Style | Large Cap Value |
| Broad Asset Class | International Equity |
| Broad Category | Equity |
| Global Peer Group | Equity Global ex US |
| Peer Group | International Multi-Cap Core |
| Global Macro | Equity Global |
| US Macro | Developed International Markets Funds |
| YCharts Categorization | -- |
| YCharts Benchmark | -- |
| Prospectus Objective | International Funds |
| Fund Owner Firm Name | John Hancock Group |
| Broad Asset Class Benchmark Index | |
| ^MSACXUSNTR | 100.0% |