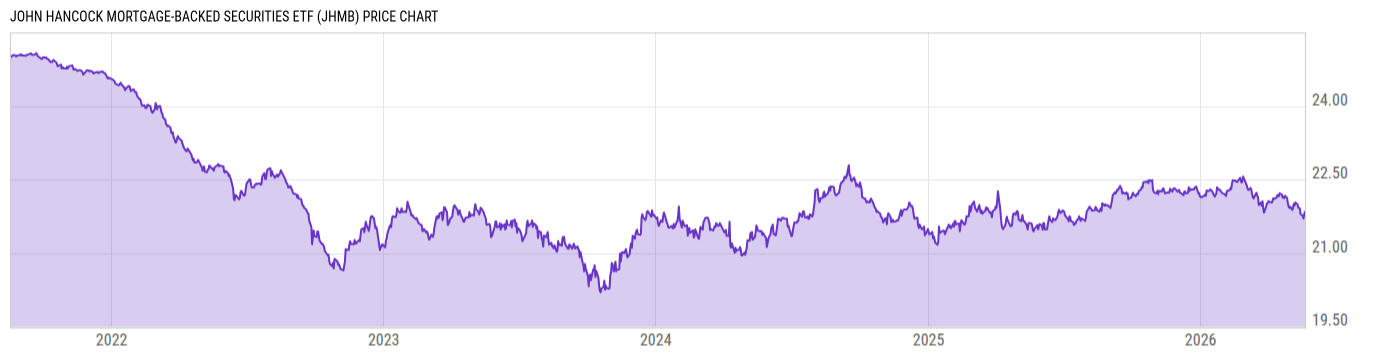
JHancock Mortgage Backed Sec ETF (JHMB)
21.98
-0.06 (-0.27%)
USD |
NYSEARCA |
Feb 03, 16:00
Price Chart
Key Stats
Customize
Expense Ratio | Discount or Premium to NAV | Total Assets Under Management | 30-Day Average Daily Volume |
---|---|---|---|
0.39% | 0.54% | 24.60M | 1049.57 |
Dividend Yield | Turnover Ratio | 1 Year Fund Level Flows | Max Drawdown (All) |
4.11% | 10.00% | 7.693M | Upgrade |
Basic Info
Investment Strategy | |
The investment seeks a high level of current income while seeking to outperform the benchmark over a market cycle. Under normal market conditions, the fund invests at least 80% of its net assets (plus any borrowings for investment purposes) in mortgage-backed securities. The fund may invest in mortgage-related securities issued or guaranteed by U.S. governmental entities and privately issued mortgage-related securities. The fund may invest up to 20% of its net assets in non-mortgage-backed securities including other asset-backed securities and Collateralized Loan Obligations (CLOs) and cash and cash equivalents. |
General | |
Security Type | Exchange-Traded Fund |
Equity Style | -- |
Fixed Income Style | -- |
Broad Asset Class | Taxable Bond |
Broad Category | Fixed Income |
Category Name | Intermediate Core Bond |
Category Index | Bloomberg US Agg Bond TR USD |
Global Category Name | US Fixed Income |
YCharts Categorization | US Fixed Income |
YCharts Benchmark | Bloomberg US Aggregate (^BBUSATR) |
Prospectus Objective | Government Bond - Mortgage |
Fund Owner Firm Name | John Hancock |
Prospectus Benchmark Index | |
N/A | 100.0% |
Broad Asset Class Benchmark Index | |
^BBUSATR | 100.0% |
Manager Tenure | |
David Bees | 1.46 yrs |
Howard Greene | 1.46 yrs |
Jeffrey Given | 1.46 yrs |
Peter Farley | 1.46 yrs |
Connor Minnaar | 0.84 yrs |
Net Fund Flows Versus Category
1 Month
% Rank:
--
--
Category Low
--
Category High
1 Year
% Rank:
46
7.693M
-3.896B
Category Low
6.584B
Category High
3 Months
% Rank:
--
--
Category Low
--
Category High
3 Years
% Rank:
--
--
Category Low
--
Category High
6 Months
% Rank:
--
--
Category Low
--
Category High
5 Years
% Rank:
--
--
Category Low
--
Category High
YTD
% Rank:
--
--
Category Low
--
Category High
10 Years
% Rank:
--
--
Category Low
--
Category High
As of January 31, 2023
Performance Versus Category
As of February 03, 2023. Returns for periods of 1 year and above are annualized.
Annual Total Returns Versus Peers
As of February 03, 2023.
Asset Allocation
Top 10 Holdings
Name | % Weight | Price | % Change |
---|---|---|---|
Us Long Bond(Cbt) Mar23 Xcbt 20230322
|
4.06% | -- | -- |
Fnma Pass-Thru I
|
1.93% | -- | -- |
Fnma Pass-Thru I
|
1.92% | -- | -- |
Fnma Pass-Thru I
|
1.84% | -- | -- |
Fnma Pass-Thru I
|
1.81% | -- | -- |
Fnma Pass-Thru I
|
1.78% | -- | -- |
Fnma Pass-Thru I
|
1.77% | -- | -- |
Fnma Pass-Thru I
|
1.55% | -- | -- |
Fnma Pass-Thru I
|
1.52% | -- | -- |
Federal National Mortgage Association
|
1.32% | -- | -- |
News
Headline
Wire
Time (ET)
PR Newswire
02/15 06:34
Basic Info
Investment Strategy | |
The investment seeks a high level of current income while seeking to outperform the benchmark over a market cycle. Under normal market conditions, the fund invests at least 80% of its net assets (plus any borrowings for investment purposes) in mortgage-backed securities. The fund may invest in mortgage-related securities issued or guaranteed by U.S. governmental entities and privately issued mortgage-related securities. The fund may invest up to 20% of its net assets in non-mortgage-backed securities including other asset-backed securities and Collateralized Loan Obligations (CLOs) and cash and cash equivalents. |
General | |
Security Type | Exchange-Traded Fund |
Equity Style | -- |
Fixed Income Style | -- |
Broad Asset Class | Taxable Bond |
Broad Category | Fixed Income |
Category Name | Intermediate Core Bond |
Category Index | Bloomberg US Agg Bond TR USD |
Global Category Name | US Fixed Income |
YCharts Categorization | US Fixed Income |
YCharts Benchmark | Bloomberg US Aggregate (^BBUSATR) |
Prospectus Objective | Government Bond - Mortgage |
Fund Owner Firm Name | John Hancock |
Prospectus Benchmark Index | |
N/A | 100.0% |
Broad Asset Class Benchmark Index | |
^BBUSATR | 100.0% |
Manager Tenure | |
David Bees | 1.46 yrs |
Howard Greene | 1.46 yrs |
Jeffrey Given | 1.46 yrs |
Peter Farley | 1.46 yrs |
Connor Minnaar | 0.84 yrs |
Fundamentals
General | |
Distribution Yield | Upgrade |
Dividend Yield TTM (2-3-23) | 4.11% |
30-Day SEC Yield (12-31-22) | Upgrade |
7-Day SEC Yield | -- |
Number of Holdings | Upgrade |
Bond | |
Current Yield | 3.09% |
Yield to Maturity | -- |
Effective Duration | -- |
Average Coupon | Upgrade |
Average Credit Score | -- |
Average Price | Upgrade |
As of February 03, 2023
Fund Details
Key Dates | |
Inception Date | 8/18/2021 |
Last Annual Report Date | 10/31/2022 |
Last Prospectus Date | 9/1/2022 |
Attributes | |
Index Fund | No |
Inverse Fund | No |
Leveraged Fund | No |
Fund of Funds | No |
Currency Hedged Fund | No |
Synthetic Replication Fund | No |
Has Dividend Investment Plan | No |
Socially Responsible Fund | No |
News
Headline
Wire
Time (ET)
PR Newswire
02/15 06:34