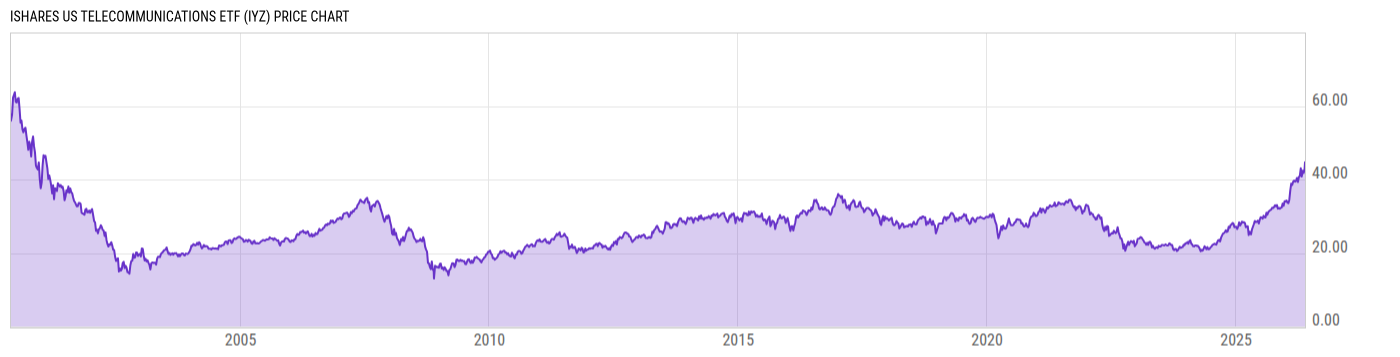
iShares US Telecommunications ETF (IYZ)
29.48
+0.08 +0.27%
BATS
Dec 6, 20:00
Delayed 2m
USD
Key Stats
Expense Ratio | 0.42% |
Total Assets Under Management | 375.79M |
Share Class Assets Under Management | 375.79M |
30-Day Average Daily Volume | 251434.5 |
Net Asset Value | 29.47 |
Discount or Premium to NAV | 0.03% |
Turnover Ratio | 35.00% |
1 Year Fund Level Flows | -51.77M |
View All IYZ News
News
-
WireHeadlineTime (ET)
-
Yahoo12/05 13:55
-
Yahoo12/04 14:00
-
Yahoo11/13 19:16
-
SA Breaking News02/08 04:14
-
SA Breaking News11/21 13:05
-
SA Breaking News11/05 13:41
-
SA Breaking News09/04 12:40
-
SA Breaking News03/26 11:12
-
SA Breaking News03/20 10:54
-
SA Breaking News11/08 05:03
Performance & Returns
Total Return (Price) | Total Return (NAV) | Cat. Total Return (NAV) | % Rank in Cat. (NAV) | |
---|---|---|---|---|
1M | -0.37% | -0.44% | 1.72% | 89 |
3M | 2.09% | 2.05% | 2.57% | 56 |
6M | 1.13% | 1.06% | 7.45% | 89 |
YTD | 13.78% | 13.78% | 21.10% | 82 |
1Y | 5.87% | 5.79% | 13.04% | 86 |
3Y | -0.88% | -0.89% | 7.16% | 100 |
5Y | 2.23% | 2.23% | 6.46% | 94 |
10Y | 7.07% | 7.08% | 9.39% | 70 |
15Y | 4.12% | 4.11% | 6.95% | 87 |
20Y | -- | -- | 2.93% | -- |
Asset Allocation
Type | % Net | % Long | % Short |
---|---|---|---|
Cash | 0.18% | 0.18% | 0.00% |
Stock | 99.82% | 99.82% | 0.00% |
Bond | 0.00% | 0.00% | 0.00% |
Convertible | 0.00% | 0.00% | 0.00% |
Preferred | 0.00% | 0.00% | 0.00% |
Other | 0.00% | 0.00% | 0.00% |
Region Exposure
Americas | 95.24% |
North America | 95.24% |
Latin America | 0.00% |
Greater Europe | 4.76% |
United Kingdom | 0.00% |
Europe Developed | 4.76% |
Europe Emerging | 0.00% |
Africa/Middle East | 0.00% |
Greater Asia | 0.00% |
Japan | 0.00% |
Australasia | 0.00% |
Asia Developed | 0.00% |
Asia Emerging | 0.00% |
Market Classification | |
% Developed Markets | 100.0% |
% Emerging Markets | 0.00% |
Stock Sector Exposure
Basic Materials | 0.00% |
Communication Services | 62.69% |
Consumer Cyclical | 0.00% |
Consumer Defensive | 0.00% |
Energy | 0.00% |
Financial Services | 0.00% |
Healthcare | 0.00% |
Industrials | 0.00% |
Real Estate | 0.00% |
Technology | 37.31% |
Utilities | 0.00% |
Stock Market Capitalization
Giant | 50.36% |
Large | 14.89% |
Medium | 25.96% |
Small | 7.97% |
Micro | 0.82% |
Stock Style Exposure
Large Cap Value | 50.36% |
Large Cap Blend | 10.12% |
Large Cap Growth | 4.76% |
Mid Cap Value | 8.28% |
Mid Cap Blend | 9.38% |
Mid Cap Growth | 8.29% |
Small Cap Value | 2.83% |
Small Cap Blend | 2.45% |
Small Cap Growth | 3.51% |
View More Holdings
As of Dec. 5, 2019
Top 10 Holdings
Symbol | Name | % Weight | Price | % Chg |
---|---|---|---|---|
VZ | Verizon Communications Inc | 23.42% | 61.19 | +0.61% |
T | AT&T Inc | 22.83% | 38.20 | +0.03% |
CTL | CenturyLink Inc | 4.78% | 14.16 | +0.14% |
GRMN | Garmin Ltd | 4.76% | 96.52 | +0.96% |
MSI | Motorola Solutions Inc | 4.49% | 160.71 | +0.17% |
TMUS | T-Mobile US Inc | 4.47% | 77.74 | +1.04% |
CSCO | Cisco Systems Inc | 4.03% | 43.84 | +0.74% |
ANET | Arista Networks Inc | 3.59% | 190.21 | -0.75% |
JNPR | Juniper Networks Inc | 2.86% | 23.97 | -0.33% |
FFIV | F5 Networks Inc | 2.86% | 138.00 | +0.03% |
Advertisement
Basic Info
Investment Strategy | |
---|---|
The investment seeks to track the investment results of the Dow Jones U.S. Select Telecommunications Index. The fund generally invests at least 90% of its assets in securities of the underlying index and in depositary receipts representing securities of the underlying index. The underlying index measures the performance of the telecommunications sector of the U.S. equity market and may include large-, mid- or small-capitalization companies. The fund is non-diversified. | |
General | |
Security Type | Exchange-Traded Fund |
Equity Style | Large Cap/Value |
Fixed Income Style | -- |
Broad Asset Class | Sector Equity |
Broad Category | Equity |
Category Name | Communications |
Prospectus Objective | Specialty - Communications |
Fund Owner Firm Name | iShares |
Benchmark Index | |
DJ US Select Telecom TR USD | 100.0% |
Reports | |
One Page Report | Download |
Manager Info
Name | Tenure |
---|---|
Alan Mason | 3.55 yrs |
Amy Whitelaw | 1.25 yrs |
Greg Savage | 11.84 yrs |
Jennifer Hsui | 7.17 yrs |
Rachel Aguirre | 1.25 yrs |
Net Fund Flows
1M | -35000.00 |
3M | -97.09M |
6M | -67.81M |
YTD | -74.36M |
1Y | -51.77M |
3Y | -50.32M |
5Y | -182.54M |
10Y | -297.89M |
Risk Info
Beta (5Y) | 0.8348 |
Max Drawdown (All) | 77.13% |
Historical Sharpe Ratio (10Y) | 0.5314 |
Historical Sortino (All) | -0.059 |
30-Day Rolling Volatility | 8.56% |
Daily Value at Risk (VaR) 1% (All) | 4.19% |
Monthly Value at Risk (VaR) 1% (All) | 16.76% |
Fundamentals
Dividend Yield TTM (12-6-19) | 1.68% |
30-Day SEC Yield | -- |
7-Day SEC Yield | -- |
Weighted Average PE Ratio | 18.83 |
Weighted Average Price to Sales Ratio | 1.731 |
Weighted Average Price to Book Ratio | 2.223 |
Weighted Median ROE | 12.78% |
Weighted Median ROA | 5.20% |
Forecasted Dividend Yield | 3.43% |
Forecasted PE Ratio | 13.55 |
Forecasted Price to Sales Ratio | 1.744 |
Forecasted Price to Book Ratio | 1.785 |
Number of Holdings | 43 |
Growth Estimates
Forecasted 5 Yr Earnings Growth | 6.05% |
Forecasted Book Value Growth | 13.18% |
Forecasted Cash Flow Growth | 6.66% |
Forecasted Earnings Growth | 15.23% |
Forecasted Revenue Growth | -1.16% |
Attributes
Key Dates | |
---|---|
Inception Date | 5/22/2000 |
Termination Date | |
Last Annual Report Date | 3/31/2019 |
Last Prospectus Date | 8/1/2019 |
Attributes | |
Exchange Traded Share | Yes |
Exchange Traded Note | No |
Enhanced Index Fund | No |
Fixed Distribution Fund | No |
High-Net Worth Individual Fund | No |
Index Fund | Yes |
Inverse Fund | No |
Leveraged Fund | No |
Fund of Funds | No |
Currency Hedged Fund | No |
Synthetic Replication Fund | No |
Has Dividend Investment Plan | No |
Socially Responsible Fund | No |
General Availability | |
Available for Insurance Product | No |
Available for Retirement Plan | No |
Available for RRSP | No |
Advertisement