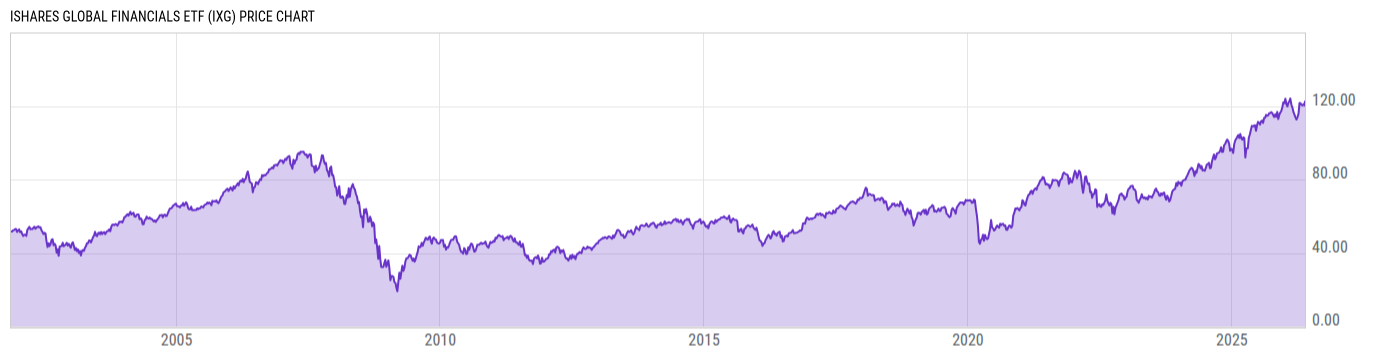
iShares Global Financials ETF (IXG)
69.88
-0.21 -0.30%
NYSE Arca
Apr 20, 20:00
Delayed 2m
USD
IXG Key Stats
Net Asset Value | Upgrade |
Discount or Premium to NAV | Upgrade |
Turnover Ratio | Upgrade |
IXG Performance
Total Return (Price) | Total Return (NAV) | Cat. Total Return (NAV) | % Rank in Cat. (NAV) | |
---|---|---|---|---|
1M | -1.98% | -1.75% | -2.19% | 29 |
3M | -6.19% | -5.68% | -3.43% | 95 |
6M | 3.42% | 3.80% | 4.99% | 69 |
YTD | -0.07% | 0.33% | 1.39% | 64 |
1Y | 19.39% | 19.76% | 17.26% | 31 |
3Y | 8.81% | 8.93% | 11.63% | 76 |
5Y | 10.22% | 10.27% | 13.47% | 86 |
10Y | 1.94% | 2.05% | 6.38% | 94 |
IXG Asset Allocation
Type | % Net | % Long | % Short |
---|---|---|---|
Cash | 0.37% | 0.37% | 0.00% |
Stock | 99.45% | 99.45% | 0.00% |
Bond | 0.00% | 0.00% | 0.00% |
Convertible | 0.00% | 0.00% | 0.00% |
Preferred | 0.00% | 0.00% | 0.00% |
Other | 0.18% | 0.18% | 0.00% |
IXG Region Exposure
Americas | 53.72% |
North America | 51.40% |
Latin America | 2.32% |
Greater Europe | 27.27% |
United Kingdom | 7.48% |
Europe Developed | 19.79% |
Europe Emerging | 0.00% |
Africa/Middle East | 0.00% |
Greater Asia | 19.01% |
Japan | 5.30% |
Australasia | 5.24% |
Asia Developed | 4.43% |
Asia Emerging | 4.04% |
Market Classification | |
% Developed Markets | 93.64% |
% Emerging Markets | 6.36% |
IXG Stock Sector Exposure
Basic Materials | 0.00% |
Communication Services | 0.00% |
Consumer Cyclical | 0.00% |
Consumer Defensive | 0.11% |
Energy | 0.00% |
Financial Services | 99.42% |
Healthcare | 0.00% |
Industrials | 0.00% |
Real Estate | 0.47% |
Technology | 0.00% |
Utilities | 0.00% |
IXG Stock Market Capitalization
Giant | 60.23% |
Large | 34.55% |
Medium | 5.23% |
Small | 0.00% |
Micro | 0.00% |
IXG Stock Style Exposure
Large Cap Value | 57.72% |
Large Cap Blend | 22.94% |
Large Cap Growth | 14.44% |
Mid Cap Value | 2.54% |
Mid Cap Blend | 1.39% |
Mid Cap Growth | 0.96% |
Small Cap Value | 0.00% |
Small Cap Blend | 0.00% |
Small Cap Growth | 0.00% |
View More Holdings
As of April 19, 2018
IXG Top 10 Holdings
Symbol | Name | % Weight | Price | % Chg |
---|---|---|---|---|
BRK.B | Berkshire Hathaway Inc B | 5.20% | 200.13 | -0.12% |
JPM | JPMorgan Chase & Co | 5.12% | 111.47 | -0.22% |
BAC | Bank of America Corporation | 3.86% | 30.26 | +2.47% |
WFC | Wells Fargo & Co | 3.03% | 52.56 | +1.98% |
HSBA | HSBC Holdings PLC | 2.68% | -- | -- |
C | Citigroup Inc | 2.41% | 70.00 | -0.40% |
00939 | China Construction Bank Corp H | 1.51% | -- | -- |
RY.TO | Royal Bank of Canada | 1.50% | 97.28 | +0.67% |
SAN | Banco Santander SA | 1.47% | -- | -- |
01299 | AIA Group Ltd | 1.44% | -- | -- |
Advertisement
IXG One Page Reports
- One Page Report Download
IXG Basic Info
Style | |
---|---|
Equity Style | Large Cap/Value |
Broad Asset Class | Sector Equity |
Broad Category | Equity |
Category Name | Financial |
Prospectus Objective | Specialty - Financial |
Fund Owner Firm Name | iShares |
Benchmark Index | |
---|---|
S&P Global 1200 Financials NR USD |
100.0% |
IXG Manager Info
Name | Tenure |
---|---|
Alan Mason | 1.71 yrs |
Diane Hsiung | 10.01 yrs |
Greg Savage | 10.01 yrs |
Jennifer Hsui | 5.42 yrs |
IXG Net Fund Flows
1M | 3.432M |
3M | 97.80M |
6M | 149.45M |
YTD | 97.80M |
1Y | 196.92M |
3Y | 310.76M |
5Y | 258.33M |
10Y | 401.30M |
IXG Risk Info
Beta (5Y) | 1.135 |
Max Drawdown (All) | 78.39% |
Historical Sharpe (10Y) | 0.2106 |
Historical Sortino (All) | 0.3397 |
30-Day Rolling Volatility | 19.12% |
Daily Value at Risk (VaR) 1% (All) | 5.04% |
Monthly Value at Risk (VaR) 1% (All) | 20.15% |
IXG Fundamentals
Dividend Yield TTM (4-20-18) | 2.12% |
SEC Yield (12-31-15) | 2.27% |
Weighted Average PE Ratio | 13.88 |
Weighted Average Price to Sales Ratio | 1.765 |
Weighted Average Price to Book Ratio | 1.240 |
Weighted Median ROE | 11.00% |
Weighted Median ROA | 1.79% |
Forecasted Dividend Yield | 3.17% |
Forecasted PE Ratio | 11.87 |
Forecasted Price to Sales Ratio | 1.659 |
Forecasted Price to Book Ratio | 1.197 |
Number of Holdings | 207 |
IXG Growth Estimates
Forecasted 5 Yr Earnings Growth | 9.20% |
Forecasted Book Value Growth | 3.42% |
Forecasted Cash Flow Growth | 7.17% |
Forecasted Earnings Growth | 6.88% |
Forecasted Revenue Growth | 3.36% |
IXG Attributes
Key Dates | |
---|---|
Inception Date | 11/12/2001 |
Termination Date | |
Last Annual Report Date | 3/31/2017 |
Last Prospectus Date | 9/30/2017 |
Attributes | |
Exchange Traded Share | Yes |
Exchange Traded Note | No |
Enhanced Index Fund | No |
Index Fund | Yes |
Inverse Fund | No |
Leveraged Fund | No |
Fund of Funds | No |
Currency Hedged Fund | No |
Synthetic Replication Fund | No |
Has Dividend Investment Plan | No |
General Availability | |
Available for Insurance Product | No |
Available for Retirement Plan | No |
Available for RRSP | No |
IXG Excel Add-In Codes
- Name: =YCI("IXG","name")
- Broad Asset Class: =YCI("IXG", "broad_asset_class")
- Broad Category: =YCI("IXG", "broad_category_group")
- Prospectus Objective: =YCI("IXG", "prospectus_objective")
To find the codes for any of our financial metrics, see our Complete Reference of Metric Codes.
Access our powerful Excel Add-in with a YCharts Professional Membership. Learn More.
Advertisement