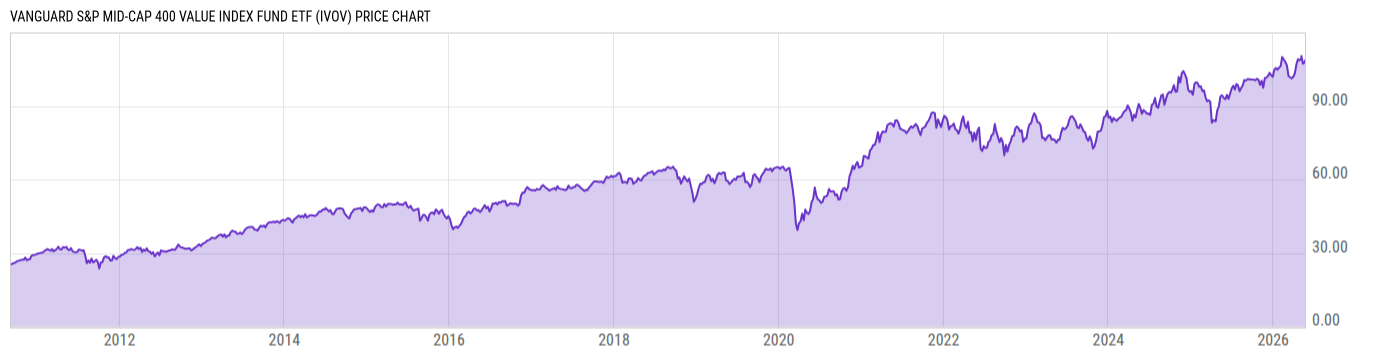
Key Stats

Expense Ratio Discount or Premium to NAV Total Assets Under Management 30-Day Average Daily Volume
0.15% 0.01% 779.93M 37216.77
Dividend Yield Turnover Ratio 1 Year Fund Level Flows Max Drawdown (All)
1.95% 33.00% 13.99M Upgrade

Basic Info

Investment Strategy
The investment seeks to track the performance of a benchmark index that measures the investment return of mid-capitalization value stocks in the United States. The fund employs an indexing investment approach designed to track the performance of the S&P MidCap 400® Value Index, which represents the value companies, as determined by the index sponsor, of the S&P MidCap 400 Index. The Advisor attempts to replicate the target index by investing all, or substantially all, of its assets in the stocks that make up the index, holding each stock in approximately the same proportion as its weighting in the index.
General
Security Type Exchange-Traded Fund
Equity Style Small Cap/Value
Fixed Income Style --
Broad Asset Class US Equity
Broad Category Equity
Category Name Mid-Cap Value
Category Index Russell Mid Cap Value TR USD
Global Category Name US Equity Mid Cap
YCharts Categorization US Mid Cap
YCharts Benchmark Russell Midcap Total Return (^RMCTR)
Prospectus Objective Growth and Income
Fund Owner Firm Name Vanguard
Prospectus Benchmark Index
S&P MidCap 400 Value TR USD 100.0%
Broad Asset Class Benchmark Index
^SPXTR 100.0%
Manager Tenure
Awais Khan 5.25 yrs
Kenny Narzikul 0.03 yrs

Net Fund Flows Versus Category

View Net Fund Flows. Upgrade now.
1M
3M
6M
YTD
1Y
3Y
5Y
10Y
 
80.00B
60.00B
40.00B
20.00B
0
-20.00B
1 Month
% Rank: --
-- Category Low
-- Category High
1 Year
% Rank: 30
13.99M
-9.518B Category Low
10.04B Category High
3 Months
% Rank: --
-- Category Low
-- Category High
3 Years
% Rank: --
-- Category Low
-- Category High
6 Months
% Rank: --
-- Category Low
-- Category High
5 Years
% Rank: --
-- Category Low
-- Category High
YTD
% Rank: --
-- Category Low
-- Category High
10 Years
% Rank: --
-- Category Low
-- Category High
As of February 28, 2023

Performance Versus Category

 
20%
15%
10%
5%
0
View Category Returns. Upgrade now.
Name
1M
3M
YTD
1Y
3Y
5Y
10Y
15Y
Total Return (Price)
--
--
--
--
--
--
--
--
Total Return (NAV)
--
--
--
--
--
--
--
--
Category Rtn. (NAV)
--
--
--
--
--
--
--
--
% Rank in Cat (NAV)
--
--
--
--
--
--
--
--
As of March 30, 2023. Returns for periods of 1 year and above are annualized.

Annual Total Returns Versus Peers

Loading chart...
Name
2016
2017
2018
2019
2020
2021
2022
YTD
26.31%
12.21%
-12.11%
25.89%
3.70%
30.44%
-7.20%
0.76%
11.96%
21.83%
-4.38%
31.49%
18.40%
28.71%
-18.11%
5.96%
26.13%
12.29%
-11.93%
25.89%
3.74%
30.52%
-7.20%
0.77%
26.18%
12.05%
-12.04%
25.67%
3.53%
30.45%
-7.10%
0.63%
19.80%
17.37%
-12.34%
24.49%
5.48%
30.99%
-12.24%
0.65%
10.61%
9.89%
-6.61%
14.50%
-22.87%
30.61%
-3.91%
-7.13%
As of March 30, 2023.

Fundamentals

General
Distribution Yield Upgrade
Dividend Yield TTM (3-30-23) 1.95%
30-Day SEC Yield (3-29-23) Upgrade
7-Day SEC Yield --
Number of Holdings Upgrade
Stock
Weighted Average PE Ratio 13.42
Weighted Average Price to Sales Ratio Upgrade
Weighted Average Price to Book Ratio Upgrade
Weighted Median ROE Upgrade
Weighted Median ROA Upgrade
Forecasted Dividend Yield Upgrade
Forecasted PE Ratio Upgrade
Forecasted Price to Sales Ratio Upgrade
Forecasted Price to Book Ratio Upgrade
As of February 28, 2023

Growth Estimates

Forecasted 5 Yr Earnings Growth Upgrade
Forecasted Book Value Growth Upgrade
Forecasted Cash Flow Growth Upgrade
Forecasted Earnings Growth Upgrade
Forecasted Revenue Growth Upgrade
As of February 28, 2023

Asset Allocation

As of February 28, 2023.
Type % Net % Long % Short
Cash 0.84% Upgrade Upgrade
Stock 99.16% Upgrade Upgrade
Bond 0.00% Upgrade Upgrade
Convertible 0.00% Upgrade Upgrade
Preferred 0.00% Upgrade Upgrade
Other 0.00% Upgrade Upgrade

Top 10 Holdings

Name % Weight Price % Change
Jabil Inc 1.02% 86.74 2.51%
Cleveland-Cliffs Inc 1.00% 18.09 0.78%
Regal Rexnord Corp 0.95% 138.90 -1.12%
Reinsurance Group of America Inc 0.88% 132.42 -0.82%
Webster Financial Corp 0.84% 39.01 -1.86%
Alcoa Corp 0.79% 41.76 2.00%
Unum Group 0.76% 39.01 -0.76%
Jones Lang LaSalle Inc 0.75% 141.22 0.38%
Lear Corp 0.75% 138.16 0.81%
Fortune Brands Innovations Inc 0.72% 57.34 -0.59%

Basic Info

Investment Strategy
The investment seeks to track the performance of a benchmark index that measures the investment return of mid-capitalization value stocks in the United States. The fund employs an indexing investment approach designed to track the performance of the S&P MidCap 400® Value Index, which represents the value companies, as determined by the index sponsor, of the S&P MidCap 400 Index. The Advisor attempts to replicate the target index by investing all, or substantially all, of its assets in the stocks that make up the index, holding each stock in approximately the same proportion as its weighting in the index.
General
Security Type Exchange-Traded Fund
Equity Style Small Cap/Value
Fixed Income Style --
Broad Asset Class US Equity
Broad Category Equity
Category Name Mid-Cap Value
Category Index Russell Mid Cap Value TR USD
Global Category Name US Equity Mid Cap
YCharts Categorization US Mid Cap
YCharts Benchmark Russell Midcap Total Return (^RMCTR)
Prospectus Objective Growth and Income
Fund Owner Firm Name Vanguard
Prospectus Benchmark Index
S&P MidCap 400 Value TR USD 100.0%
Broad Asset Class Benchmark Index
^SPXTR 100.0%
Manager Tenure
Awais Khan 5.25 yrs
Kenny Narzikul 0.03 yrs

Fundamentals

General
Distribution Yield Upgrade
Dividend Yield TTM (3-30-23) 1.95%
30-Day SEC Yield (3-29-23) Upgrade
7-Day SEC Yield --
Number of Holdings Upgrade
Stock
Weighted Average PE Ratio 13.42
Weighted Average Price to Sales Ratio Upgrade
Weighted Average Price to Book Ratio Upgrade
Weighted Median ROE Upgrade
Weighted Median ROA Upgrade
Forecasted Dividend Yield Upgrade
Forecasted PE Ratio Upgrade
Forecasted Price to Sales Ratio Upgrade
Forecasted Price to Book Ratio Upgrade
As of February 28, 2023

Growth Estimates

Forecasted 5 Yr Earnings Growth Upgrade
Forecasted Book Value Growth Upgrade
Forecasted Cash Flow Growth Upgrade
Forecasted Earnings Growth Upgrade
Forecasted Revenue Growth Upgrade
As of February 28, 2023

Fund Details

Key Dates
Inception Date 9/7/2010
Last Annual Report Date 8/31/2022
Last Prospectus Date 12/17/2021
Attributes
Index Fund Yes
Inverse Fund No
Leveraged Fund No
Fund of Funds No
Currency Hedged Fund No
Synthetic Replication Fund No
Has Dividend Investment Plan No
Socially Responsible Fund No

Top Portfolio Holders

0 of 0