

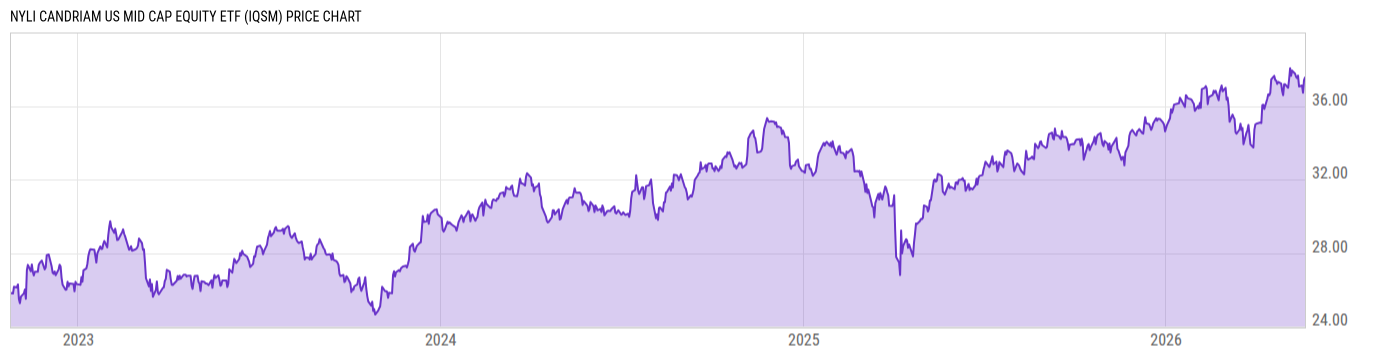
NYLI Candriam US Mid Cap Equity ETF (IQSM)
38.01
-0.05
(-0.13%)
USD |
NYSEARCA |
Jun 08, 16:00
Price Chart
Key Stats
| Net Expense Ratio | Discount or Premium to NAV | Total Assets Under Management | 30-Day Average Daily Volume |
|---|---|---|---|
| 0.15% | 0.04% | 321.06M | 5253.87 |
| Weighted Average Dividend Yield | Turnover Ratio (Generic) | 1 Year Fund Level Flows | Max Drawdown (Since Inception) |
| 1.43% | 47.00% | 64.81M |
Basic Info
| Investment Strategy | |
| The Fund seeks investment results that correspond generally to the price and yield performance of its underlying index, the IQ Candriam US Mid Cap Equity Index. Under normal circumstances, the Fund will invest at least 80% of its assets in securities of companies that meet the ESG selection of the Underlying Index. |
| General | |
| Security Type | Exchange-Traded Fund |
| Equity Style | Small Cap Core |
| Broad Asset Class | US Equity |
| Broad Category | Equity |
| Global Peer Group | Equity US Sm&Mid Cap |
| Peer Group | Small-Cap Core Funds |
| Global Macro | Equity North America |
| US Macro | Small-Cap Funds |
| YCharts Categorization | -- |
| YCharts Benchmark | -- |
| Prospectus Objective | Mid-Cap Funds |
| Fund Owner Firm Name | New York Life Investments |
| Broad Asset Class Benchmark Index | |
| ^SPXTR | 100.0% |
Performance Versus Peer Group
Annual Total Returns Versus Peers
As of June 09, 2026.
Asset Allocation
As of May 31, 2026.
| Type | % Net |
|---|---|
| Cash | 0.10% |
| Stock | 99.88% |
| Bond | 0.03% |
| Convertible | 0.00% |
| Preferred | 0.00% |
| Other | -0.01% |
Basic Info
| Investment Strategy | |
| The Fund seeks investment results that correspond generally to the price and yield performance of its underlying index, the IQ Candriam US Mid Cap Equity Index. Under normal circumstances, the Fund will invest at least 80% of its assets in securities of companies that meet the ESG selection of the Underlying Index. |
| General | |
| Security Type | Exchange-Traded Fund |
| Equity Style | Small Cap Core |
| Broad Asset Class | US Equity |
| Broad Category | Equity |
| Global Peer Group | Equity US Sm&Mid Cap |
| Peer Group | Small-Cap Core Funds |
| Global Macro | Equity North America |
| US Macro | Small-Cap Funds |
| YCharts Categorization | -- |
| YCharts Benchmark | -- |
| Prospectus Objective | Mid-Cap Funds |
| Fund Owner Firm Name | New York Life Investments |
| Broad Asset Class Benchmark Index | |
| ^SPXTR | 100.0% |