

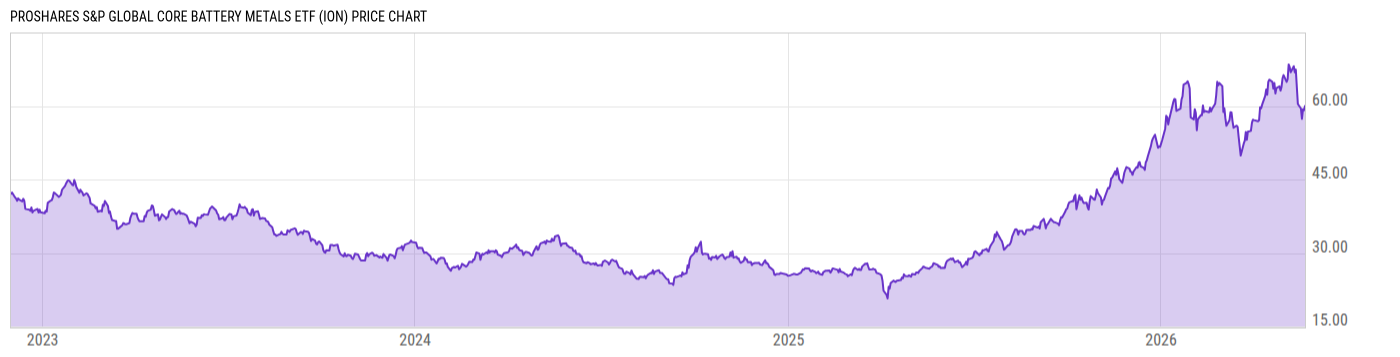
ProShares S&P Global Core Battery Metals ETF (ION)
53.30
-0.55
(-1.02%)
USD |
NYSEARCA |
Jun 08, 16:00
53.30
0.00 (0.00%)
After-Hours: 20:00
Price Chart
Key Stats
| Net Expense Ratio | Discount or Premium to NAV | Total Assets Under Management | 30-Day Average Daily Volume |
|---|---|---|---|
| 0.58% | -3.42% | 15.33M | 6275.93 |
| Weighted Average Dividend Yield | Turnover Ratio (Generic) | 1 Year Fund Level Flows | Max Drawdown (Since Inception) |
| 1.08% | 54.00% | 10.38M |
Basic Info
| Investment Strategy | |
| The Fund seeks investment results that track the performance of the S&P Global Core Battery Metals Index. The Fund will invest at least 80% of its net assets in the securities that comprise the Index. The Index consists of companies engaged in the mining of lithium, nickel or cobalt-base metals used to produce batteries. |
| General | |
| Security Type | Exchange-Traded Fund |
| Equity Style | Multi Cap Core |
| Broad Asset Class | Sector Equity |
| Broad Category | Equity |
| Global Peer Group | Equity Sector Materials |
| Peer Group | Basic Materials Funds |
| Global Macro | Equity Industry Sector |
| US Macro | Sector Equity Funds |
| YCharts Categorization | -- |
| YCharts Benchmark | -- |
| Prospectus Objective | Precious Metals Equity Funds |
| Fund Owner Firm Name | ProShares |
| Broad Asset Class Benchmark Index | |
| ^MSWNTR | 100.0% |
Performance Versus Peer Group
Annual Total Returns Versus Peers
As of June 08, 2026.
Asset Allocation
As of April 30, 2026.
| Type | % Net |
|---|---|
| Cash | 0.23% |
| Stock | 99.67% |
| Bond | 0.00% |
| Convertible | 0.00% |
| Preferred | 0.00% |
| Other | 0.10% |
Basic Info
| Investment Strategy | |
| The Fund seeks investment results that track the performance of the S&P Global Core Battery Metals Index. The Fund will invest at least 80% of its net assets in the securities that comprise the Index. The Index consists of companies engaged in the mining of lithium, nickel or cobalt-base metals used to produce batteries. |
| General | |
| Security Type | Exchange-Traded Fund |
| Equity Style | Multi Cap Core |
| Broad Asset Class | Sector Equity |
| Broad Category | Equity |
| Global Peer Group | Equity Sector Materials |
| Peer Group | Basic Materials Funds |
| Global Macro | Equity Industry Sector |
| US Macro | Sector Equity Funds |
| YCharts Categorization | -- |
| YCharts Benchmark | -- |
| Prospectus Objective | Precious Metals Equity Funds |
| Fund Owner Firm Name | ProShares |
| Broad Asset Class Benchmark Index | |
| ^MSWNTR | 100.0% |