

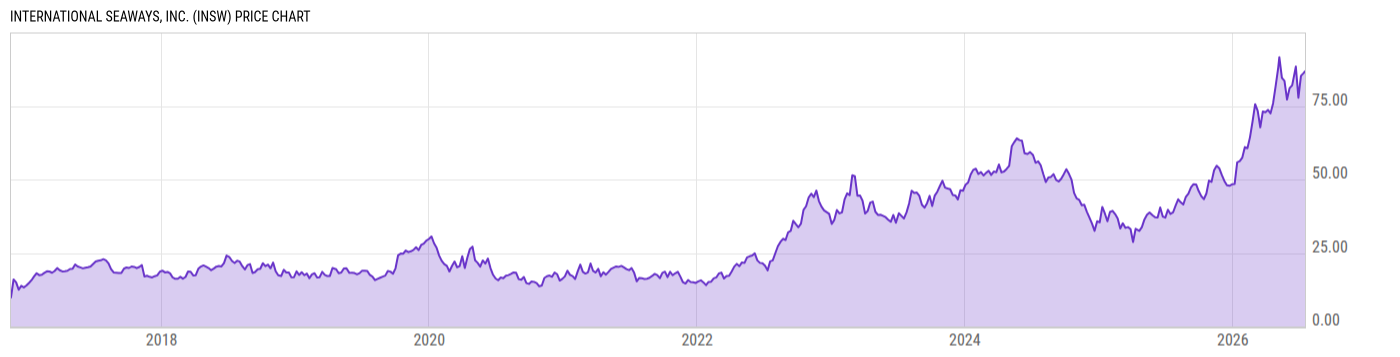
International Seaways, Inc. (INSW)
86.76
-1.47
(-1.67%)
USD |
NYSE |
Jul 17, 16:00
86.75
-0.01
(-0.01%)
After-Hours: 20:00
Price Chart
Key Stats
| Price and Performance | |
|---|---|
| Market Cap | 4.295B |
| 52 Week High (Daily) | |
| 52 Week Low (Daily) | |
| All-Time High (Daily) | |
| Year to Date Total Returns (Daily) | |
| 1 Month Total Returns (Daily) | |
| 1 Year Total Returns (Daily) | 148.8% |
| Valuation | |
| PE Ratio | 7.894 |
| PE Ratio (Forward) | |
| PS Ratio | 4.369 |
| Price to Book Value | 1.957 |
| EV to EBITDA | |
| Dividend | |
|---|---|
| Dividend | 4.55 |
| Dividend Yield (Forward) | |
| Financials | |
| Revenue (5 Year Growth) | |
| Revenue (Quarterly YoY Growth) | |
| EPS Diluted (5 Year Growth) | |
| EPS Diluted (Quarterly YoY Growth) | |
| Debt to Equity Ratio | 0.2781 |
| Return on Equity | |
| Return on Assets | |
| Risk | |
| Beta (5Y) | |
| Max Drawdown (5Y) | 50.96% |
Profile
| International Seaways, Inc. engages in the transportation of crude oil and petroleum products. It operates through the following segments: Crude Tankers and Product Carriers. The Crude Tankers segment consists of a fleet of vessels that transport unrefined petroleum. The Product Carriers segment focuses on crude and refined petroleum products. The company was founded on December 6, 1999 and is headquartered in New York, NY. |
| URL | http://www.intlseas.com |
| Investor Relations URL | https://www.intlseas.com/investor-relations/overview |
| HQ State/Province | New York |
| Sector | Energy |
| Industry | Oil, Gas & Consumable Fuels |
| Equity Style | Small Cap Core |
| Next Earnings Release | Aug. 05, 2026 (est.) |
| Last Earnings Release | May. 07, 2026 |
| Next Ex-Dividend Date | N/A |
| Last Ex-Dividend Date | Jun. 12, 2026 |