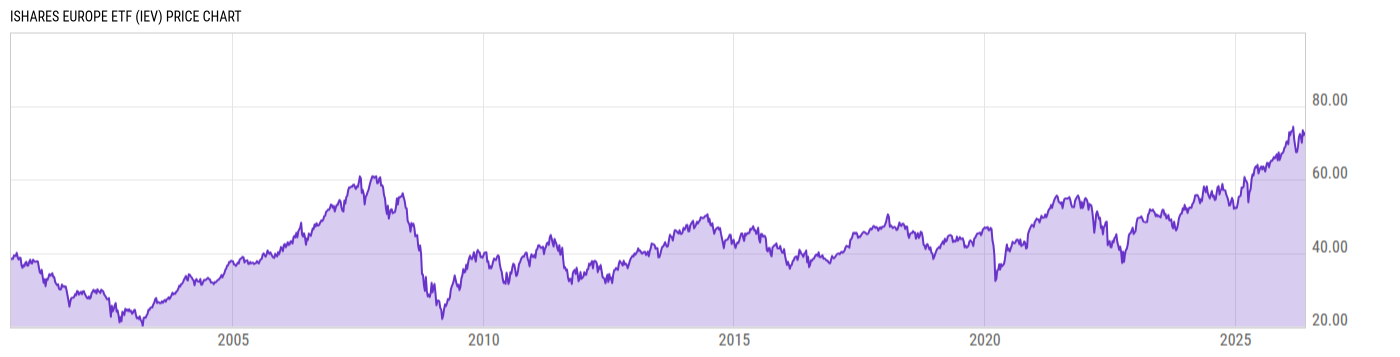
iShares Europe ETF (IEV)
41.58
-1.18 (-2.75%)
USD |
NYSEARCA |
Jul 05, 16:00
41.58
0.00 (0.00%)
After-Hours: 18:46
Price Chart
Key Stats
Customize
Expense Ratio | Discount or Premium to NAV | Total Assets Under Management | 30-Day Average Daily Volume |
---|---|---|---|
0.63% | 0.08% | 1.574B | 558135.0 |
Dividend Yield | Turnover Ratio | 1 Year Fund Level Flows | Max Drawdown (All) |
4.42% | 5.00% | 99.27M | Upgrade |
Basic Info
Investment Strategy | |
The investment seeks to track the investment results of the S&P Europe 350TM, which measures the performance of the stocks of leading companies in the following countries: Austria, Belgium, Denmark, Finland, France, Germany, Ireland, Italy, Luxembourg, the Netherlands, Norway, Portugal, Spain, Sweden, Switzerland and the United Kingdom. The fund generally invests at least 80% of its assets in securities of the index and in depositary receipts representing securities of the index. The underlying index is a subset of the S&P Global 1200, which is designed to measure the performance of large-capitalization stocks from major globalmarkets, as determined by SPDJI. |
General | |
Security Type | Exchange-Traded Fund |
Equity Style | Large Cap/Blend |
Fixed Income Style | -- |
Broad Asset Class | International Equity |
Broad Category | Equity |
Category Name | Europe Stock |
Category Index | MSCI Europe NR USD |
Prospectus Objective | Europe Stock |
Fund Owner Firm Name | iShares |
Prospectus Benchmark Index | |
S&P Europe 350 NR USD | 100.0% |
Broad Asset Class Benchmark Index | |
^MSACXUSNTR | 100.0% |
Manager Tenure | |
Greg Savage | 14.50 yrs |
Jennifer Hsui | 9.92 yrs |
Amy Whitelaw | 3.92 yrs |
Paul Whitehead | 0.49 yrs |
Net Fund Flows Versus Category
1 Month
% Rank:
--
--
Category Low
--
Category High
1 Year
% Rank:
9
99.27M
-1.675B
Category Low
1.474B
Category High
3 Months
% Rank:
--
--
Category Low
--
Category High
3 Years
% Rank:
--
--
Category Low
--
Category High
6 Months
% Rank:
--
--
Category Low
--
Category High
5 Years
% Rank:
--
--
Category Low
--
Category High
YTD
% Rank:
--
--
Category Low
--
Category High
10 Years
% Rank:
--
--
Category Low
--
Category High
As of June 30, 2022
Performance Versus Category
As of July 01, 2022. Returns for periods of 1 year and above are annualized.
Annual Total Returns Versus Peers
As of July 01, 2022.
Asset Allocation
Top 10 Holdings
Name | % Weight | Price | % Change |
---|---|---|---|
Nestle SA
|
3.85% | -- | -- |
Roche Holding AG
|
2.73% | -- | -- |
Novartis AG
|
2.34% | -- | -- |
AstraZeneca PLC
|
2.33% | -- | -- |
Shell PLC
|
2.28% | -- | -- |
ASML Holding NV
|
2.12% | -- | -- |
Novo Nordisk A/S Class B
|
2.07% | -- | -- |
LVMH Moet Hennessy Louis Vuitton SE
|
1.88% | -- | -- |
HSBC Holdings PLC
|
1.53% | -- | -- |
TotalEnergies SE
|
1.49% | -- | -- |
News
Headline
Wire
Time (ET)
SA Breaking News
11/09 08:01
SA Breaking News
04/14 04:38
Basic Info
Investment Strategy | |
The investment seeks to track the investment results of the S&P Europe 350TM, which measures the performance of the stocks of leading companies in the following countries: Austria, Belgium, Denmark, Finland, France, Germany, Ireland, Italy, Luxembourg, the Netherlands, Norway, Portugal, Spain, Sweden, Switzerland and the United Kingdom. The fund generally invests at least 80% of its assets in securities of the index and in depositary receipts representing securities of the index. The underlying index is a subset of the S&P Global 1200, which is designed to measure the performance of large-capitalization stocks from major globalmarkets, as determined by SPDJI. |
General | |
Security Type | Exchange-Traded Fund |
Equity Style | Large Cap/Blend |
Fixed Income Style | -- |
Broad Asset Class | International Equity |
Broad Category | Equity |
Category Name | Europe Stock |
Category Index | MSCI Europe NR USD |
Prospectus Objective | Europe Stock |
Fund Owner Firm Name | iShares |
Prospectus Benchmark Index | |
S&P Europe 350 NR USD | 100.0% |
Broad Asset Class Benchmark Index | |
^MSACXUSNTR | 100.0% |
Manager Tenure | |
Greg Savage | 14.50 yrs |
Jennifer Hsui | 9.92 yrs |
Amy Whitelaw | 3.92 yrs |
Paul Whitehead | 0.49 yrs |
Fundamentals
General | |
Distribution Yield | Upgrade |
Dividend Yield TTM (7-5-22) | 4.42% |
30-Day SEC Yield (4-29-22) | Upgrade |
7-Day SEC Yield | -- |
Number of Holdings | Upgrade |
Stock | |
Weighted Average PE Ratio | 12.53 |
Weighted Average Price to Sales Ratio | Upgrade |
Weighted Average Price to Book Ratio | Upgrade |
Weighted Median ROE | Upgrade |
Weighted Median ROA | Upgrade |
Forecasted Dividend Yield | Upgrade |
Forecasted PE Ratio | Upgrade |
Forecasted Price to Sales Ratio | Upgrade |
Forecasted Price to Book Ratio | Upgrade |
As of July 01, 2022
Growth Estimates
Fund Details
Key Dates | |
Inception Date | 7/25/2000 |
Last Annual Report Date | 3/31/2022 |
Last Prospectus Date | 7/30/2021 |
Attributes | |
Enhanced Index Fund | No |
Index Fund |
|
Inverse Fund | No |
Leveraged Fund | No |
Fund of Funds | No |
Currency Hedged Fund | No |
Synthetic Replication Fund | No |
Has Dividend Investment Plan | No |
Socially Responsible Fund | No |
News
Headline
Wire
Time (ET)
SA Breaking News
11/09 08:01
SA Breaking News
04/14 04:38