

iShares S&P 500 GBP Hedged UCITS ETF (Acc) (IE00B3Y8X563)
174.48
+0.52
(+0.30%)
GBP |
LSE |
Sep 16, 16:00
Scatter Plot
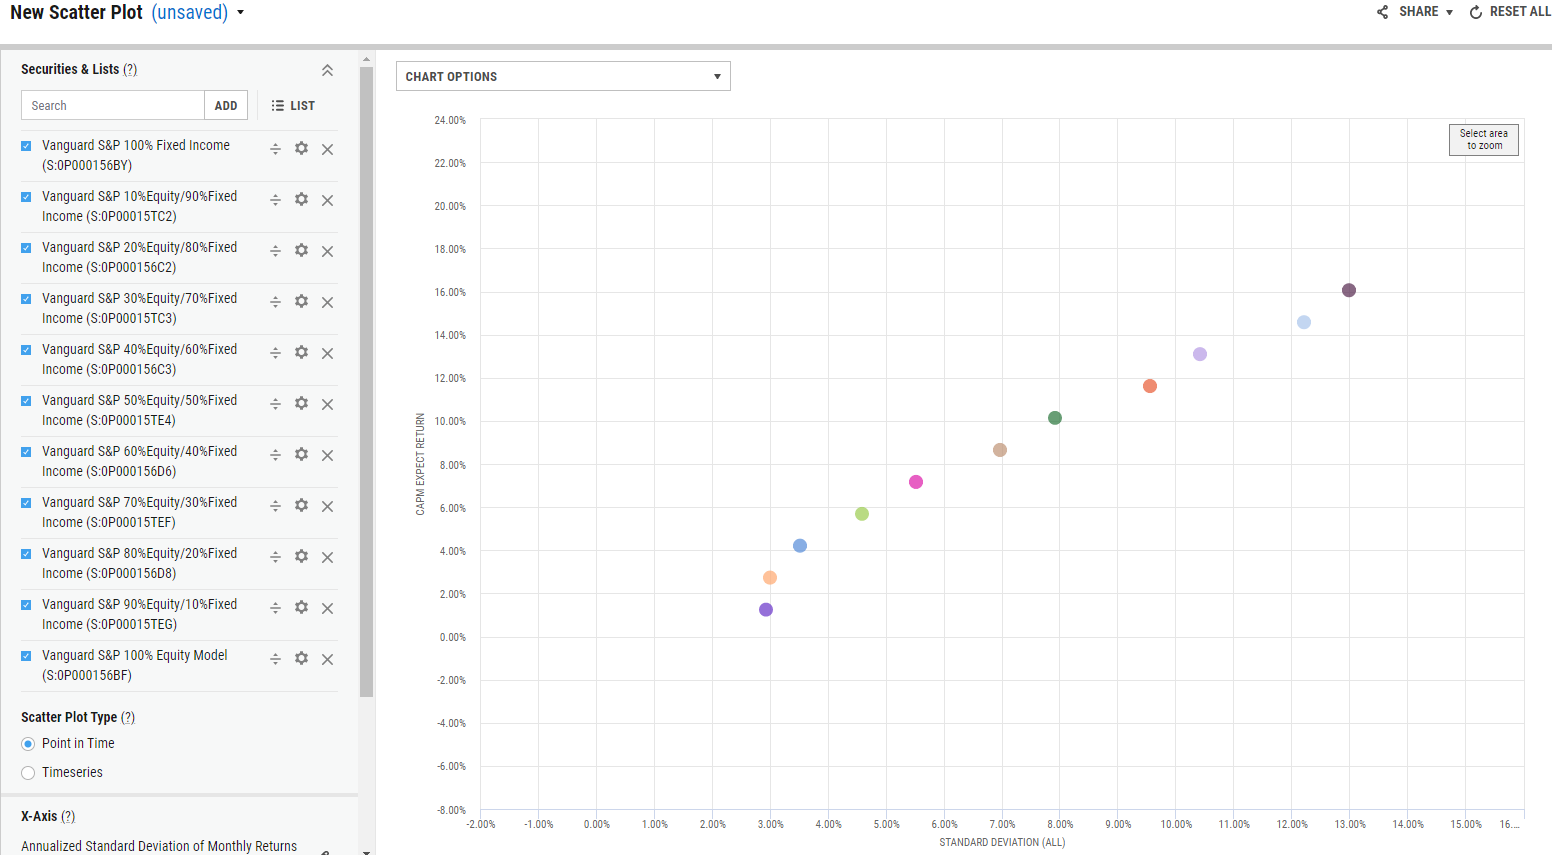
The Scatter Plot tool enables you to create a chart within YCharts that can compare and contrast different variables. Once you choose your securities and/or lists, you can pick any two metrics on YCharts to plot your x-axis and y-axis data points. You can also plot a point-in-time scatter plot, or a timeseries scatter plot.
QUESTIONS?
- Email: support@ycharts.com
- Call: (866) 965-7552
READY TO GET STARTED?
Unlock My AccessAccess Edit Scatter Plot Now
Unlock access to Edit Scatter Plot by registering below. No credit card required.
Unlock My AccessQUESTIONS?
- Email: support@ycharts.com
- Call: (866) 965-7552