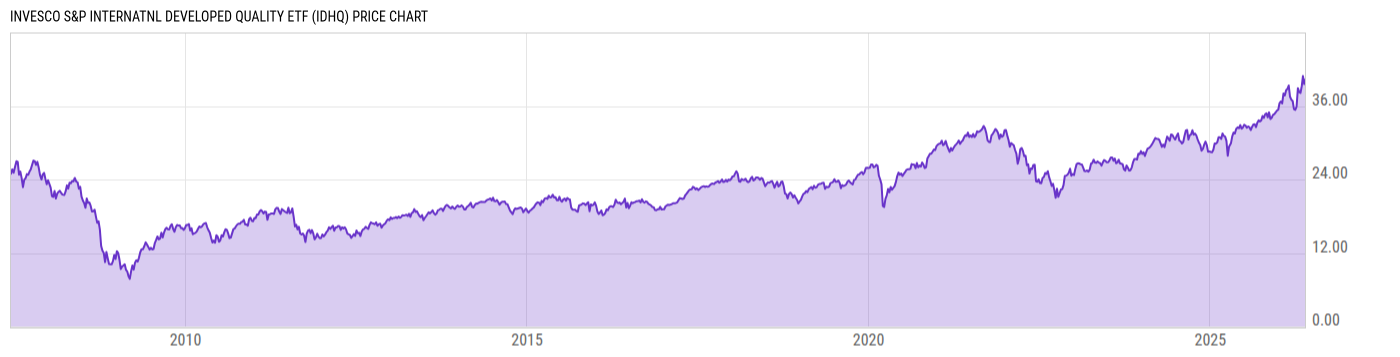
Invesco S&P International Dev Qual ETF (IDHQ)
28.94
+0.39 (+1.37%)
USD |
Mar 01, 10:23
Price Chart
Key Stats
Customize
Expense Ratio | Discount or Premium to NAV | Total Assets Under Management | 30-Day Average Daily Volume |
---|---|---|---|
0.29% | -0.04% | 99.96M | 17467.70 |
Dividend Yield | Turnover Ratio | 1 Year Fund Level Flows | Max Drawdown (All) |
1.63% | 42.00% | 21.86M | Upgrade |
Basic Info
Investment Strategy | |
The investment seeks to track the investment results (before fees and expenses) of the S&P Quality Developed ex-U.S. LargeMidCap Index (the "underlying index"). The fund will invest at least 90% of its total assets in securities that comprise the underlying index. The index provider compiles, maintains and calculates the underlying index, which is constructed from constituents of the S&P Developed ex-U.S. LargeMidCap Index that the index provider identifies as being of the highest quality-that is, stocks of companies that seek to generate higher revenue and cash flow than their counterparts through prudent use of assets and finances. |
General | |
Security Type | Exchange-Traded Fund |
Equity Style | Large Cap/Growth |
Fixed Income Style | -- |
Broad Asset Class | International Equity |
Broad Category | Equity |
Category Name | Foreign Large Growth |
Category Index | MSCI ACWI Ex USA Growth NR USD |
Prospectus Objective | Foreign Stock |
Fund Owner Firm Name | Invesco |
Prospectus Benchmark Index | |
S&P Quality Develop xUS Large Mid NR USD | 100.0% |
Broad Asset Class Benchmark Index | |
^MSACXUSNTR | 100.0% |
Manager Tenure | |
Peter Hubbard | 13.65 yrs |
Michael Jeanette | 5.93 yrs |
Tony Seisser | 5.93 yrs |
Pratik Doshi | 0.93 yrs |
Net Fund Flows Versus Category
1 Month
% Rank:
--
--
Category Low
--
Category High
1 Year
% Rank:
38
21.86M
-17.62B
Category Low
9.241B
Category High
3 Months
% Rank:
--
--
Category Low
--
Category High
3 Years
% Rank:
--
--
Category Low
--
Category High
6 Months
% Rank:
--
--
Category Low
--
Category High
5 Years
% Rank:
--
--
Category Low
--
Category High
YTD
% Rank:
--
--
Category Low
--
Category High
10 Years
% Rank:
--
--
Category Low
--
Category High
As of January 31, 2021
Performance Versus Category
As of February 26, 2021. Returns for periods of 1 year and above are annualized.
Annual Total Returns Versus Peers
Edit comparables
As of February 26, 2021.
Asset Allocation
Top 10 Holdings
Name | % Weight | Price | % Change |
---|---|---|---|
ASML Holding NV
|
5.80% | -- | -- |
Novartis AG
|
4.68% | -- | -- |
Roche Holding AG
|
4.64% | -- | -- |
Nestle SA
|
4.63% | -- | -- |
Unilever PLC
|
3.61% | -- | -- |
Novo Nordisk A/S B
|
3.09% | -- | -- |
Sanofi SA
|
2.67% | -- | -- |
Rio Tinto PLC
|
2.17% | -- | -- |
CSL Ltd
|
2.14% | -- | -- |
BHP Group Ltd
|
2.13% | -- | -- |
News
Headline
Wire
Time (ET)
SA Breaking News
10/23 11:53
Basic Info
Investment Strategy | |
The investment seeks to track the investment results (before fees and expenses) of the S&P Quality Developed ex-U.S. LargeMidCap Index (the "underlying index"). The fund will invest at least 90% of its total assets in securities that comprise the underlying index. The index provider compiles, maintains and calculates the underlying index, which is constructed from constituents of the S&P Developed ex-U.S. LargeMidCap Index that the index provider identifies as being of the highest quality-that is, stocks of companies that seek to generate higher revenue and cash flow than their counterparts through prudent use of assets and finances. |
General | |
Security Type | Exchange-Traded Fund |
Equity Style | Large Cap/Growth |
Fixed Income Style | -- |
Broad Asset Class | International Equity |
Broad Category | Equity |
Category Name | Foreign Large Growth |
Category Index | MSCI ACWI Ex USA Growth NR USD |
Prospectus Objective | Foreign Stock |
Fund Owner Firm Name | Invesco |
Prospectus Benchmark Index | |
S&P Quality Develop xUS Large Mid NR USD | 100.0% |
Broad Asset Class Benchmark Index | |
^MSACXUSNTR | 100.0% |
Manager Tenure | |
Peter Hubbard | 13.65 yrs |
Michael Jeanette | 5.93 yrs |
Tony Seisser | 5.93 yrs |
Pratik Doshi | 0.93 yrs |
Fundamentals
General | |
Distribution Yield | Upgrade |
Dividend Yield TTM (3-1-21) | 1.63% |
30-Day SEC Yield (1-31-21) | Upgrade |
7-Day SEC Yield | -- |
Number of Holdings | Upgrade |
Stock | |
Weighted Average PE Ratio | 22.33 |
Weighted Average Price to Sales Ratio | Upgrade |
Weighted Average Price to Book Ratio | Upgrade |
Weighted Median ROE | Upgrade |
Weighted Median ROA | Upgrade |
Forecasted Dividend Yield | Upgrade |
Forecasted PE Ratio | Upgrade |
Forecasted Price to Sales Ratio | Upgrade |
Forecasted Price to Book Ratio | Upgrade |
As of February 25, 2021
Growth Estimates
Fund Details
Key Dates | |
Inception Date | 6/13/2007 |
Last Annual Report Date | 10/31/2020 |
Last Prospectus Date | 2/28/2020 |
Attributes | |
Enhanced Index Fund | No |
Index Fund |
|
Inverse Fund | No |
Leveraged Fund | No |
Fund of Funds | No |
Currency Hedged Fund | No |
Synthetic Replication Fund | No |
Has Dividend Investment Plan | No |
Socially Responsible Fund | No |
News
Headline
Wire
Time (ET)
SA Breaking News
10/23 11:53