

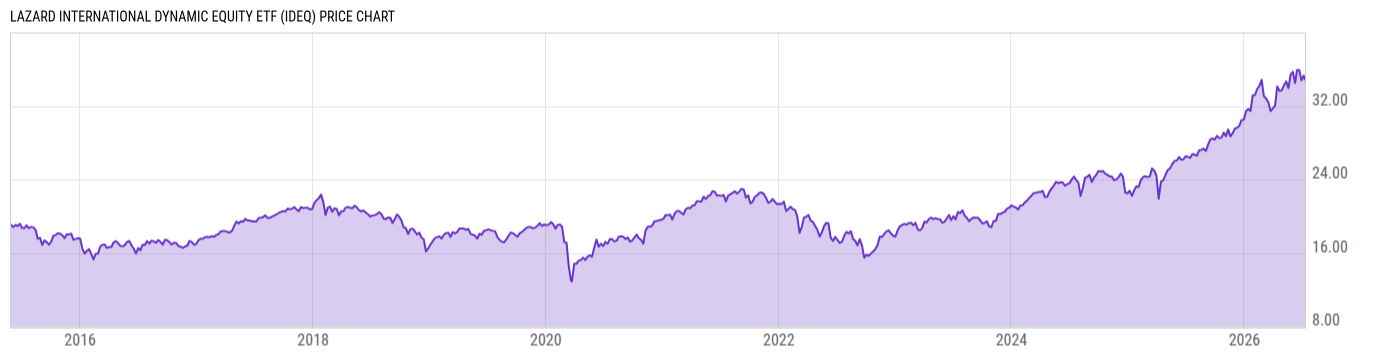
Lazard International Dynamic Equity ETF (IDEQ)
34.88
+0.02
(+0.06%)
USD |
NYSEARCA |
Jul 10, 16:00
34.91
+0.03
(+0.09%)
After-Hours: 20:00
Price Chart
Key Stats
| Net Expense Ratio | Discount or Premium to NAV | Total Assets Under Management | 30-Day Average Daily Volume |
|---|---|---|---|
| 0.40% | 0.84% | 1.524B | 371993.9 |
| Weighted Average Dividend Yield | Turnover Ratio (Generic) | 1 Year Fund Level Flows | Max Drawdown (Since Inception) |
| -- | 88.00% | 1.310B |
Basic Info
| Investment Strategy | |
| The investment seeks long-term capital appreciation. Under normal circumstances, the Portfolio invests at least 80% of its net assets (plus any borrowings for investment purposes) in equity securities of companies whose principal business activities are located in India. In addition to common stocks, preferred stocks and convertible securities, such equity securities also may include American Depositary Receipts (“ADRs”), Global Depositary Receipts and European Depositary Receipts. Companies that have 50% or more of their assets in or revenue or net income from India are considered to have their principal activities located in India. |
| General | |
| Security Type | Exchange-Traded Fund |
| Equity Style | Large Cap Core |
| Broad Asset Class | International Equity |
| Broad Category | Equity |
| Global Peer Group | Equity Global ex US |
| Peer Group | International Large-Cap Core |
| Global Macro | Equity Global |
| US Macro | Developed International Markets Funds |
| YCharts Categorization | -- |
| YCharts Benchmark | -- |
| Prospectus Objective | International Funds |
| Fund Owner Firm Name | Lazard |
| Broad Asset Class Benchmark Index | |
| ^MSACXUSNTR | 100.0% |
Performance Versus Peer Group
Annual Total Returns Versus Peers
As of July 13, 2026.
Asset Allocation
As of July 10, 2026.
| Type | % Net |
|---|---|
| Cash | 1.00% |
| Stock | 99.00% |
| Bond | 0.00% |
| Convertible | 0.00% |
| Preferred | 0.00% |
| Other | 0.00% |
Basic Info
| Investment Strategy | |
| The investment seeks long-term capital appreciation. Under normal circumstances, the Portfolio invests at least 80% of its net assets (plus any borrowings for investment purposes) in equity securities of companies whose principal business activities are located in India. In addition to common stocks, preferred stocks and convertible securities, such equity securities also may include American Depositary Receipts (“ADRs”), Global Depositary Receipts and European Depositary Receipts. Companies that have 50% or more of their assets in or revenue or net income from India are considered to have their principal activities located in India. |
| General | |
| Security Type | Exchange-Traded Fund |
| Equity Style | Large Cap Core |
| Broad Asset Class | International Equity |
| Broad Category | Equity |
| Global Peer Group | Equity Global ex US |
| Peer Group | International Large-Cap Core |
| Global Macro | Equity Global |
| US Macro | Developed International Markets Funds |
| YCharts Categorization | -- |
| YCharts Benchmark | -- |
| Prospectus Objective | International Funds |
| Fund Owner Firm Name | Lazard |
| Broad Asset Class Benchmark Index | |
| ^MSACXUSNTR | 100.0% |