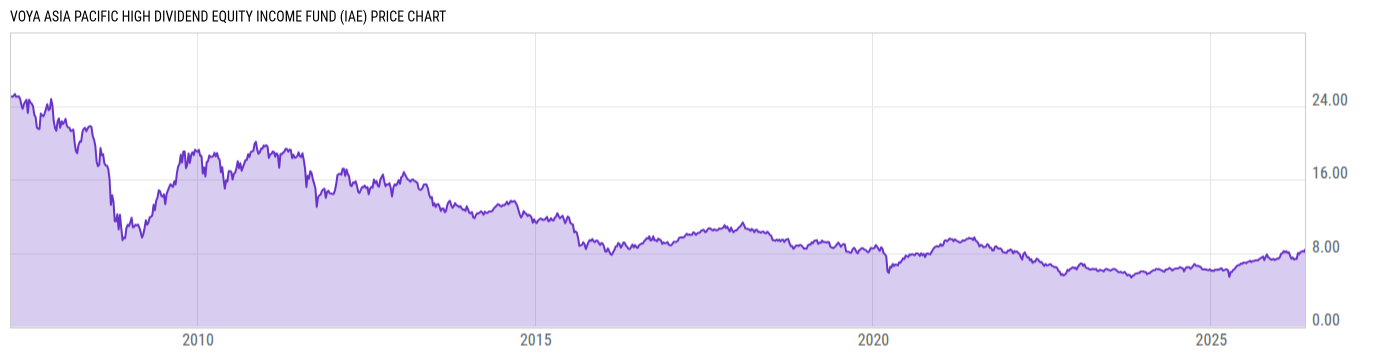
Voya Asia Pacific High Dividend Eq (IAE)
10.31
+0.01 +0.10%
NYSE
Apr 25, 20:00
Delayed 2m
USD
IAE Key Stats
Net Asset Value | Upgrade |
Discount or Premium to NAV | Upgrade |
Turnover Ratio | Upgrade |
View All IAE News
IAE News
-
WireHeadlineTime (ET)
-
SA Breaking News03/15 17:54
-
Business Wire03/15 16:30
-
SA Breaking News12/15 16:56
-
Business Wire12/15 16:30
-
PR Newswire09/27 17:06
-
SA Breaking News09/18 11:57
-
PR Newswire09/15 16:30
-
SA Breaking News06/15 16:57
-
PR Newswire06/15 16:30
-
SA Breaking News03/15 17:50
IAE Performance
Total Return (Price) | Total Return (NAV) | Cat. Total Return (NAV) | % Rank in Cat. (NAV) | |
---|---|---|---|---|
1M | 2.07% | 1.17% | 2.78% | 81 |
3M | -7.22% | -7.84% | -4.92% | 91 |
6M | -1.03% | -0.06% | 1.75% | 77 |
YTD | 0.22% | -2.27% | -1.38% | 72 |
1Y | 11.64% | 9.56% | 8.10% | 48 |
3Y | 3.80% | 2.86% | 4.74% | 67 |
5Y | 2.30% | 2.67% | 6.35% | 81 |
10Y | 3.24% | 2.52% | 4.89% | 84 |
IAE Asset Allocation
Type | % Net | % Long | % Short |
---|---|---|---|
Cash | 2.08% | 2.10% | 0.01% |
Stock | 97.92% | 98.49% | 0.57% |
Bond | 0.00% | 0.00% | 0.00% |
Convertible | 0.00% | 0.00% | 0.00% |
Preferred | 0.00% | 0.00% | 0.00% |
Other | 0.00% | 0.00% | 0.00% |
IAE Region Exposure
Americas | 0.00% |
North America | 0.00% |
Latin America | 0.00% |
Greater Europe | 1.33% |
United Kingdom | 1.33% |
Europe Developed | 0.00% |
Europe Emerging | 0.00% |
Africa/Middle East | 0.00% |
Greater Asia | 98.67% |
Japan | 0.00% |
Australasia | 20.40% |
Asia Developed | 33.07% |
Asia Emerging | 45.20% |
Market Classification | |
% Developed Markets | 54.80% |
% Emerging Markets | 45.20% |
IAE Stock Sector Exposure
Basic Materials | 8.33% |
Communication Services | 6.51% |
Consumer Cyclical | 10.23% |
Consumer Defensive | 7.12% |
Energy | 4.16% |
Financial Services | 29.81% |
Healthcare | 2.04% |
Industrials | 7.48% |
Real Estate | 7.52% |
Technology | 10.47% |
Utilities | 6.34% |
IAE Stock Market Capitalization
Giant | 48.82% |
Large | 30.66% |
Medium | 18.35% |
Small | 2.17% |
Micro | 0.00% |
IAE Stock Style Exposure
Large Cap Value | 43.32% |
Large Cap Blend | 29.18% |
Large Cap Growth | 6.98% |
Mid Cap Value | 15.71% |
Mid Cap Blend | 2.63% |
Mid Cap Growth | 0.00% |
Small Cap Value | 2.17% |
Small Cap Blend | 0.00% |
Small Cap Growth | 0.00% |
View More Holdings
As of Dec. 31, 2017
IAE Top 10 Holdings
Symbol | Name | % Weight | Price | % Chg |
---|---|---|---|---|
AAIGF | AIA Group Ltd | 3.09% | -- | -- |
CICHF | China Construction Bank Corp H | 3.09% | -- | -- |
CHLKF | China Mobile Ltd | 2.96% | -- | -- |
ANEWF | Australia and New Zealand Banking Group Ltd | 2.88% | -- | -- |
BABA | Alibaba Group Holding Ltd ADR | 2.86% | 170.22 | -1.66% |
SSNLF | Samsung Electronics Co Ltd | 2.73% | -- | -- |
WEBNF | Westpac Banking Corp | 2.40% | -- | -- |
IDCBF | Industrial And Commercial Bank Of China Ltd H | 2.18% | -- | -- |
RTNTF | Rio Tinto Ltd | 2.13% | -- | -- |
PCCYF | PetroChina Co Ltd H | 1.86% | -- | -- |
Advertisement
IAE One Page Reports
- One Page Report Download
IAE Basic Info
Style | |
---|---|
Equity Style | Large Cap/Value |
Broad Asset Class | Alternative |
Broad Category | Alternative |
Category Name | Options-based |
Prospectus Objective | Pacific Stock |
Fund Owner Firm Name | Voya Investments, LLC |
IAE Manager Info
Name | Tenure |
---|---|
Manu Vandenbulck | 10.69 yrs |
Nicolas Simar | 10.69 yrs |
Robert Davis | 10.69 yrs |
Willem van Dommelen | 10.69 yrs |
IAE Net Fund Flows
1M | 0.00 |
3M | -5.111M |
6M | -10.44M |
YTD | 0.00 |
1Y | -17.79M |
3Y | -57.97M |
5Y | -- |
10Y | -- |
IAE Risk Info
Beta (5Y) | 1.180 |
Max Drawdown (All) | 60.83% |
Historical Sharpe (10Y) | 0.3145 |
Historical Sortino (All) | 0.3219 |
30-Day Rolling Volatility | 19.02% |
Daily Value at Risk (VaR) 1% (All) | 4.67% |
Monthly Value at Risk (VaR) 1% (All) | 19.01% |
IAE Fundamentals
Dividend Yield TTM (4-24-18) | 2.39% |
SEC Yield (1-31-18) | 1.38% |
Weighted Average PE Ratio | 12.24 |
Weighted Average Price to Sales Ratio | 1.114 |
Weighted Average Price to Book Ratio | 1.222 |
Weighted Median ROE | 11.88% |
Weighted Median ROA | 4.85% |
Forecasted Dividend Yield | 3.91% |
Forecasted PE Ratio | 11.11 |
Forecasted Price to Sales Ratio | 1.214 |
Forecasted Price to Book Ratio | 1.258 |
Number of Holdings | 87 |
IAE Growth Estimates
Forecasted 5 Yr Earnings Growth | 9.39% |
Forecasted Book Value Growth | 3.72% |
Forecasted Cash Flow Growth | -0.74% |
Forecasted Earnings Growth | -4.31% |
Forecasted Revenue Growth | -1.86% |
IAE Attributes
Key Dates | |
---|---|
Inception Date | 3/27/2007 |
Termination Date | |
Last Annual Report Date | 2/28/2017 |
Last Prospectus Date | 2/28/2015 |
Attributes | |
Exchange Traded Share | No |
Exchange Traded Note | No |
Enhanced Index Fund | No |
Index Fund | No |
Inverse Fund | No |
Leveraged Fund | No |
Fund of Funds | No |
Currency Hedged Fund | No |
Synthetic Replication Fund | No |
Has Dividend Investment Plan | Yes |
General Availability | |
Available for Insurance Product | No |
Available for Retirement Plan | No |
Available for RRSP | No |
IAE Excel Add-In Codes
- Name: =YCI("IAE","name")
- Broad Asset Class: =YCI("IAE", "broad_asset_class")
- Broad Category: =YCI("IAE", "broad_category_group")
- Prospectus Objective: =YCI("IAE", "prospectus_objective")
To find the codes for any of our financial metrics, see our Complete Reference of Metric Codes.
Access our powerful Excel Add-in with a YCharts Professional Membership. Learn More.
Advertisement