

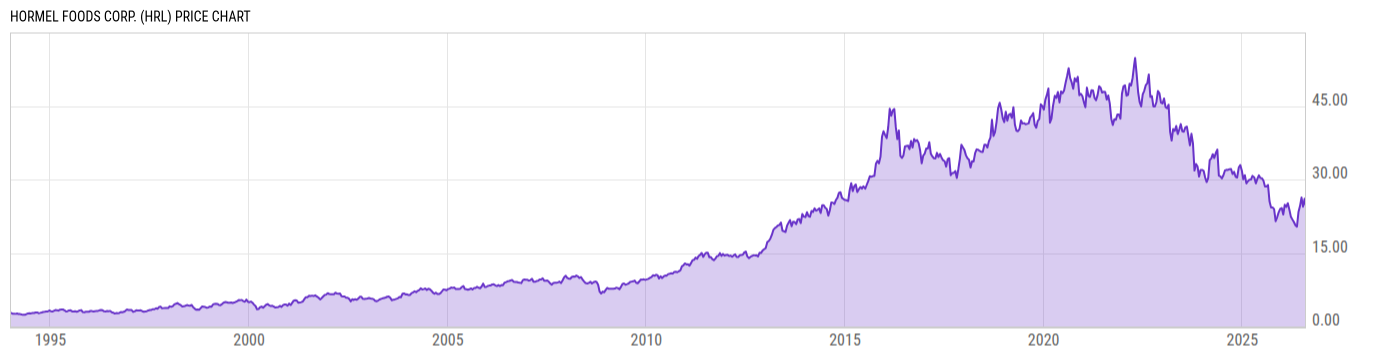
Hormel Foods Corp. (HRL)
25.04
-0.32
(-1.28%)
USD |
NYSE |
Jul 31, 15:55
Price Chart
Key Stats
| Price and Performance | |
|---|---|
| Market Cap | 13.78B |
| 52 Week High (Daily) | |
| 52 Week Low (Daily) | |
| All-Time High (Daily) | |
| Year to Date Total Returns (Daily) | |
| 1 Month Total Returns (Daily) | |
| 1 Year Total Returns (Daily) | -5.64% |
| Valuation | |
| PE Ratio | 29.54 |
| PE Ratio (Forward) | |
| PS Ratio | 1.129 |
| Price to Book Value | 1.734 |
| EV to EBITDA | |
| Dividend | |
|---|---|
| Dividend | 0.2925 |
| Dividend Yield (Forward) | |
| Financials | |
| Revenue (5 Year Growth) | |
| Revenue (Quarterly YoY Growth) | |
| EPS Diluted (5 Year Growth) | |
| EPS Diluted (Quarterly YoY Growth) | |
| Debt to Equity Ratio | 0.3593 |
| Return on Equity | |
| Return on Assets | |
| Risk | |
| Beta (5Y) | |
| Max Drawdown (5Y) | 58.47% |
Profile
| Hormel Foods Corp. engages in the manufacturing and marketing of branded food products. It operates through the following segments: Retail, Foodservice, and International. The Retail segment consists of the processing, marketing, and sale of food products sold predominantly in the retail market. The Foodservice segment includes the processing, marketing, and sale of food and nutritional products for foodservice, convenience store, and commercial customers. The International segment focuses on processing, marketing, and selling company products internationally. The company was founded by George A. Hormel in 1891 and is headquartered in Austin, MN. |
| URL | http://www.hormelfoods.com |
| Investor Relations URL | https://investor.hormelfoods.com |
| HQ State/Province | Minnesota |
| Sector | Consumer Staples |
| Industry | Food Products |
| Equity Style | Small Cap Value |
| Next Earnings Release | Aug. 27, 2026 (est.) |
| Last Earnings Release | May. 28, 2026 |
| Next Ex-Dividend Date | N/A |
| Last Ex-Dividend Date | Jul. 13, 2026 |