

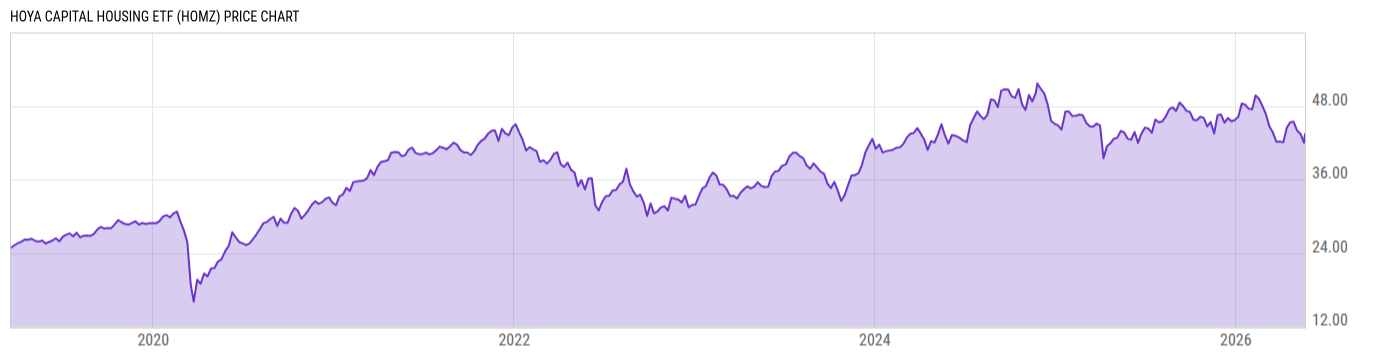
Hoya Capital Housing ETF (HOMZ)
43.87
+0.02
(+0.05%)
USD |
NYSEARCA |
Jun 08, 16:00
43.87
0.00 (0.00%)
After-Hours: 18:38
Price Chart
Key Stats
| Net Expense Ratio | Discount or Premium to NAV | Total Assets Under Management | 30-Day Average Daily Volume |
|---|---|---|---|
| 0.30% | -0.06% | 34.00M | 2353.00 |
| Weighted Average Dividend Yield | Turnover Ratio (Generic) | 1 Year Fund Level Flows | Max Drawdown (Since Inception) |
| 2.95% | 12.00% | -892628.0 |
Basic Info
| Investment Strategy | |
| The Fund seeks to track the performance of the Hoya Capital Housing 100 Index. The Fund invest at least 80% of its assets in the component securities of the Index. The Fund uses a passive management or indexing investment approach to track the performance, before fees and expenses, of the Index. |
| General | |
| Security Type | Exchange-Traded Fund |
| Equity Style | Mid Cap Value |
| Broad Asset Class | Sector Equity |
| Broad Category | Equity |
| Global Peer Group | Equity Sector Real Estate US |
| Peer Group | Real Estate Funds |
| Global Macro | Equity Real Estate |
| US Macro | Sector Equity Funds |
| YCharts Categorization | -- |
| YCharts Benchmark | -- |
| Prospectus Objective | Real Estate Funds |
| Fund Owner Firm Name | Homz The Housing ETF |
| Broad Asset Class Benchmark Index | |
| ^MSWNTR | 100.0% |
Performance Versus Peer Group
Annual Total Returns Versus Peers
As of June 08, 2026.
Asset Allocation
As of April 30, 2026.
| Type | % Net |
|---|---|
| Cash | 0.22% |
| Stock | 99.50% |
| Bond | 0.24% |
| Convertible | 0.00% |
| Preferred | 0.00% |
| Other | 0.03% |
Basic Info
| Investment Strategy | |
| The Fund seeks to track the performance of the Hoya Capital Housing 100 Index. The Fund invest at least 80% of its assets in the component securities of the Index. The Fund uses a passive management or indexing investment approach to track the performance, before fees and expenses, of the Index. |
| General | |
| Security Type | Exchange-Traded Fund |
| Equity Style | Mid Cap Value |
| Broad Asset Class | Sector Equity |
| Broad Category | Equity |
| Global Peer Group | Equity Sector Real Estate US |
| Peer Group | Real Estate Funds |
| Global Macro | Equity Real Estate |
| US Macro | Sector Equity Funds |
| YCharts Categorization | -- |
| YCharts Benchmark | -- |
| Prospectus Objective | Real Estate Funds |
| Fund Owner Firm Name | Homz The Housing ETF |
| Broad Asset Class Benchmark Index | |
| ^MSWNTR | 100.0% |