

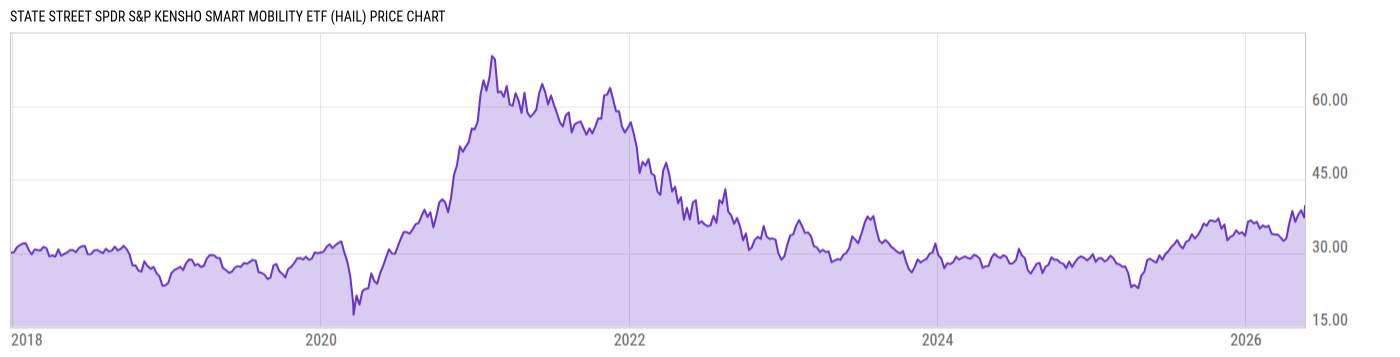
State Street SPDR S&P Kensho Smart Mobility ETF (HAIL)
37.27
-0.96
(-2.51%)
USD |
NYSEARCA |
May 19, 16:00
37.20
-0.07
(-0.18%)
After-Hours: 20:00
Price Chart
Key Stats
| Net Expense Ratio | Discount or Premium to NAV | Total Assets Under Management | 30-Day Average Daily Volume |
|---|---|---|---|
| 0.45% | -0.08% | 20.25M | 1922.67 |
| Weighted Average Dividend Yield | Turnover Ratio (Generic) | 1 Year Fund Level Flows | Max Drawdown (Since Inception) |
| 0.63% | 33.00% | -6.920M |
Basic Info
| Investment Strategy | |
| The Fund seeks to provide investment results that correspond to the total return performance of the S&P Kensho Smart Transportation Index. The Fund invests at least 80% of its assets in the components of the Index designed to capture companies whose products and services are driving innovation behind smart transportation. |
| General | |
| Security Type | Exchange-Traded Fund |
| Equity Style | Mid Cap Core |
| Broad Asset Class | Sector Equity |
| Broad Category | Equity |
| Global Peer Group | Equity Theme - Infrastructure |
| Peer Group | Global Infrastructure Funds |
| Global Macro | Equity Theme |
| US Macro | World Sector Equity Funds |
| YCharts Categorization | -- |
| YCharts Benchmark | -- |
| Prospectus Objective | Global Infrastructure Funds |
| Fund Owner Firm Name | State Street Investment Management |
| Broad Asset Class Benchmark Index | |
| ^MSWNTR | 100.0% |
Performance Versus Peer Group
Annual Total Returns Versus Peers
As of May 20, 2026.
Asset Allocation
As of April 30, 2026.
| Type | % Net |
|---|---|
| Cash | 0.05% |
| Stock | 99.85% |
| Bond | 0.06% |
| Convertible | 0.00% |
| Preferred | 0.00% |
| Other | 0.05% |
Basic Info
| Investment Strategy | |
| The Fund seeks to provide investment results that correspond to the total return performance of the S&P Kensho Smart Transportation Index. The Fund invests at least 80% of its assets in the components of the Index designed to capture companies whose products and services are driving innovation behind smart transportation. |
| General | |
| Security Type | Exchange-Traded Fund |
| Equity Style | Mid Cap Core |
| Broad Asset Class | Sector Equity |
| Broad Category | Equity |
| Global Peer Group | Equity Theme - Infrastructure |
| Peer Group | Global Infrastructure Funds |
| Global Macro | Equity Theme |
| US Macro | World Sector Equity Funds |
| YCharts Categorization | -- |
| YCharts Benchmark | -- |
| Prospectus Objective | Global Infrastructure Funds |
| Fund Owner Firm Name | State Street Investment Management |
| Broad Asset Class Benchmark Index | |
| ^MSWNTR | 100.0% |