

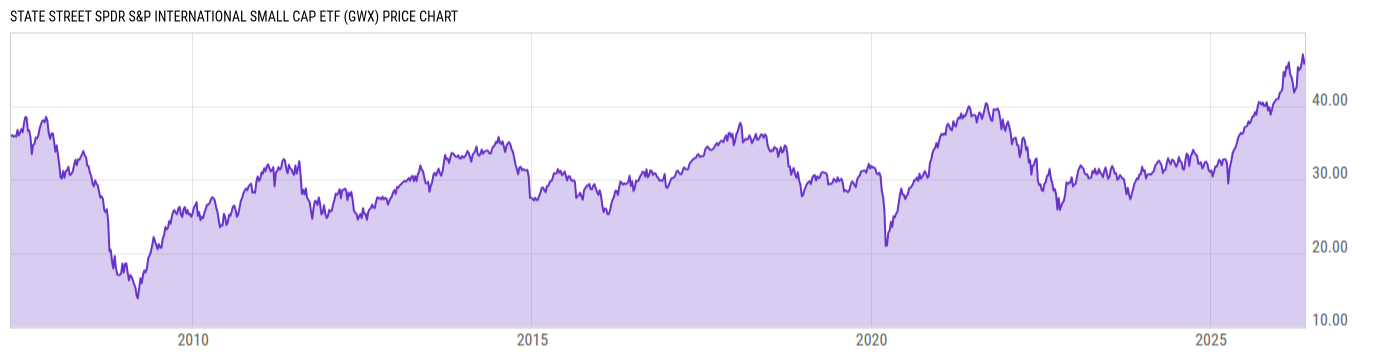
State Street SPDR S&P International Small Cap ETF (GWX)
44.51
+0.21
(+0.47%)
USD |
NYSEARCA |
Jun 08, 16:00
44.52
+0.01
(+0.02%)
After-Hours: 20:00
Price Chart
Key Stats
| Net Expense Ratio | Discount or Premium to NAV | Total Assets Under Management | 30-Day Average Daily Volume |
|---|---|---|---|
| 0.40% | 0.36% | 883.42M | 70720.13 |
| Weighted Average Dividend Yield | Turnover Ratio (Generic) | 1 Year Fund Level Flows | Max Drawdown (Since Inception) |
| 2.22% | 14.00% | -14.76M |
Basic Info
| Investment Strategy | |
| The Fund seeks to provide investment results that correspond generally to the total return performance of an index based upon the developed world (ex-US) small cap equity markets. The Fund generally invests at least 80% of its total assets in the securities comprising the Index and in depositary receipts. |
| General | |
| Security Type | Exchange-Traded Fund |
| Equity Style | Small Cap Core |
| Broad Asset Class | International Equity |
| Broad Category | Equity |
| Global Peer Group | Equity Global ex US Sm&Mid Cap |
| Peer Group | International Small/Mid-Cap Core |
| Global Macro | Equity Global |
| US Macro | Developed International Markets Funds |
| YCharts Categorization | -- |
| YCharts Benchmark | -- |
| Prospectus Objective | International Small-Cap Funds |
| Fund Owner Firm Name | State Street Investment Management |
| Broad Asset Class Benchmark Index | |
| ^MSACXUSNTR | 100.0% |
Performance Versus Peer Group
Annual Total Returns Versus Peers
As of June 09, 2026.
Asset Allocation
As of April 30, 2026.
| Type | % Net |
|---|---|
| Cash | 0.67% |
| Stock | 98.30% |
| Bond | 0.00% |
| Convertible | 0.00% |
| Preferred | 0.18% |
| Other | 0.84% |
Basic Info
| Investment Strategy | |
| The Fund seeks to provide investment results that correspond generally to the total return performance of an index based upon the developed world (ex-US) small cap equity markets. The Fund generally invests at least 80% of its total assets in the securities comprising the Index and in depositary receipts. |
| General | |
| Security Type | Exchange-Traded Fund |
| Equity Style | Small Cap Core |
| Broad Asset Class | International Equity |
| Broad Category | Equity |
| Global Peer Group | Equity Global ex US Sm&Mid Cap |
| Peer Group | International Small/Mid-Cap Core |
| Global Macro | Equity Global |
| US Macro | Developed International Markets Funds |
| YCharts Categorization | -- |
| YCharts Benchmark | -- |
| Prospectus Objective | International Small-Cap Funds |
| Fund Owner Firm Name | State Street Investment Management |
| Broad Asset Class Benchmark Index | |
| ^MSACXUSNTR | 100.0% |