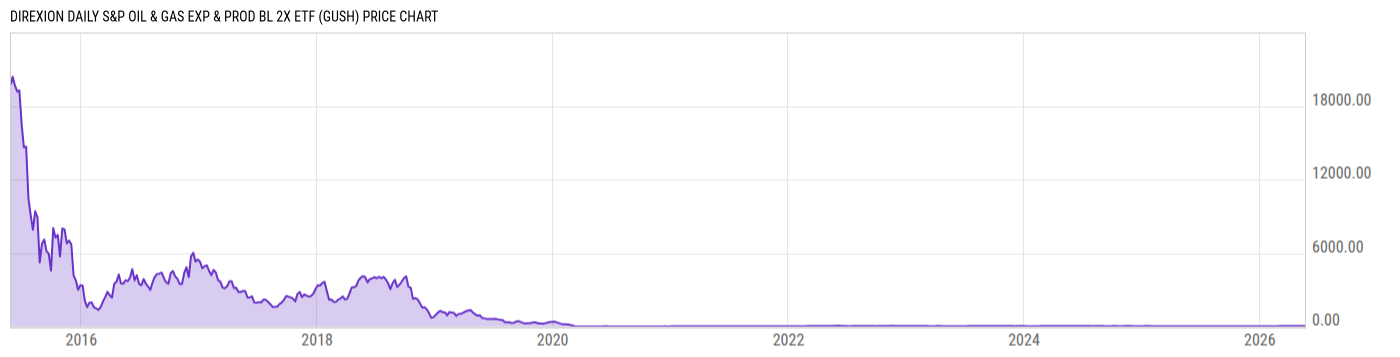
Direxion Dly S&P Oil&Gs Ex&Prd Bl 2X ETF (GUSH)
122.94
+2.59
(+2.15%)
USD |
NYSEARCA |
Mar 31, 16:00
122.05
-0.89
(-0.72%)
After-Hours: 20:00
Key Stats
Expense Ratio | Discount or Premium to NAV | Total Assets Under Management | 30-Day Average Daily Volume |
---|---|---|---|
0.99% | -0.24% | 656.66M | 573711.4 |
Dividend Yield | Turnover Ratio | 1 Year Fund Level Flows | Max Drawdown (All) |
1.48% | 55.00% | -385.17M | Upgrade |
Basic Info
Investment Strategy | |
The investment seeks daily investment results, of 200% of the daily performance of the S&P Oil & Gas Exploration & Production Select Industry Index. The index measures the performance of the oil and gas exploration and production sub-industry determined based on the GICS. The fund invests at least 80% of its net assets in financial instruments, such as swap agreements, securities of the index, and ETFs that track the index and other financial instruments that provide daily leveraged exposure to the index or to ETFs that track the index which provide returns consistent with the objective. It is non-diversified. |
General | |
Security Type | Exchange-Traded Fund |
Equity Style | Mid Cap/Value |
Fixed Income Style | -- |
Broad Asset Class | Miscellaneous |
Broad Category | Miscellaneous |
Category Name | Trading--Leveraged Equity |
Category Index | S&P 500 TR USD |
Global Category Name | Trading Tools |
YCharts Categorization | Other |
YCharts Benchmark | S&P 500 Total Return (^SPXTR) |
Prospectus Objective | Specialty - Natural Resources |
Fund Owner Firm Name | Direxion Funds |
Prospectus Benchmark Index | |
S&P Oil&Gas Explor&Pro Sel Indust TR USD | 200.0% |
Broad Asset Class Benchmark Index | |
^SPXTR | 100.0% |
Manager Tenure | |
Paul Brigandi | 7.76 yrs |
Tony Ng | 7.42 yrs |
Net Fund Flows Versus Category
1 Month
% Rank:
--
--
Category Low
--
Category High
1 Year
% Rank:
100
-385.17M
-474.20M
Category Low
4.729B
Category High
3 Months
% Rank:
--
--
Category Low
--
Category High
3 Years
% Rank:
--
--
Category Low
--
Category High
6 Months
% Rank:
--
--
Category Low
--
Category High
5 Years
% Rank:
--
--
Category Low
--
Category High
YTD
% Rank:
--
--
Category Low
--
Category High
10 Years
% Rank:
--
--
Category Low
--
Category High
As of February 28, 2023
Risk
Performance Versus Category
As of March 31, 2023. Returns for periods of 1 year and above are annualized.
Annual Total Returns Versus Peers
As of March 31, 2023.
Asset Allocation
Top 10 Holdings
Name | % Weight | Price | % Change |
---|---|---|---|
Dreyfus Government Secs Cash Mgmt Admin | 33.28% | 1.00 | 0.00% |
Goldman Sachs FS Treasury Intms Instl | 4.18% | 1.00 | 0.00% |
Goldman Finl Sq Trsry Ins
|
2.95% | -- | -- |
Goldman Finl Sq Trsry Ins
|
2.77% | -- | -- |
Marathon Petroleum Corp | 1.44% | 134.83 | 0.66% |
Occidental Petroleum Corp | 1.43% | 62.43 | 0.18% |
Valero Energy Corp | 1.43% | 139.60 | 1.88% |
EQT Corp | 1.43% | 31.91 | 1.98% |
CNX Resources Corp | 1.42% | 16.02 | 2.36% |
Hess Corp | 1.41% | 132.34 | -0.10% |
News
Headline
Wire
Time (ET)
SA Breaking News
03/31 19:15
SA Breaking News
03/29 19:35
SA Breaking News
03/28 17:50
SA Breaking News
03/24 18:55
SA Breaking News
03/23 18:45
SA Breaking News
03/23 07:39
SA Breaking News
03/17 19:45
SA Breaking News
03/13 10:11
Basic Info
Investment Strategy | |
The investment seeks daily investment results, of 200% of the daily performance of the S&P Oil & Gas Exploration & Production Select Industry Index. The index measures the performance of the oil and gas exploration and production sub-industry determined based on the GICS. The fund invests at least 80% of its net assets in financial instruments, such as swap agreements, securities of the index, and ETFs that track the index and other financial instruments that provide daily leveraged exposure to the index or to ETFs that track the index which provide returns consistent with the objective. It is non-diversified. |
General | |
Security Type | Exchange-Traded Fund |
Equity Style | Mid Cap/Value |
Fixed Income Style | -- |
Broad Asset Class | Miscellaneous |
Broad Category | Miscellaneous |
Category Name | Trading--Leveraged Equity |
Category Index | S&P 500 TR USD |
Global Category Name | Trading Tools |
YCharts Categorization | Other |
YCharts Benchmark | S&P 500 Total Return (^SPXTR) |
Prospectus Objective | Specialty - Natural Resources |
Fund Owner Firm Name | Direxion Funds |
Prospectus Benchmark Index | |
S&P Oil&Gas Explor&Pro Sel Indust TR USD | 200.0% |
Broad Asset Class Benchmark Index | |
^SPXTR | 100.0% |
Manager Tenure | |
Paul Brigandi | 7.76 yrs |
Tony Ng | 7.42 yrs |
Fundamentals
General | |
Distribution Yield | Upgrade |
Dividend Yield TTM (3-31-23) | 1.48% |
30-Day SEC Yield | -- |
7-Day SEC Yield | -- |
Number of Holdings | Upgrade |
Stock | |
Weighted Average PE Ratio | 4.448 |
Weighted Average Price to Sales Ratio | Upgrade |
Weighted Average Price to Book Ratio | Upgrade |
Weighted Median ROE | Upgrade |
Weighted Median ROA | Upgrade |
Forecasted Dividend Yield | Upgrade |
Forecasted PE Ratio | Upgrade |
Forecasted Price to Sales Ratio | Upgrade |
Forecasted Price to Book Ratio | Upgrade |
As of March 29, 2023
Fund Details
Key Dates | |
Inception Date | 5/28/2015 |
Last Annual Report Date | 10/31/2022 |
Last Prospectus Date | 2/28/2023 |
Attributes | |
Index Fund |
|
Inverse Fund | No |
Leveraged Fund |
|
Fund of Funds | No |
Currency Hedged Fund | No |
Synthetic Replication Fund | No |
Has Dividend Investment Plan | No |
Socially Responsible Fund | No |
News
Headline
Wire
Time (ET)
SA Breaking News
03/31 19:15
SA Breaking News
03/29 19:35
SA Breaking News
03/28 17:50
SA Breaking News
03/24 18:55
SA Breaking News
03/23 18:45
SA Breaking News
03/23 07:39
SA Breaking News
03/17 19:45
SA Breaking News
03/13 10:11