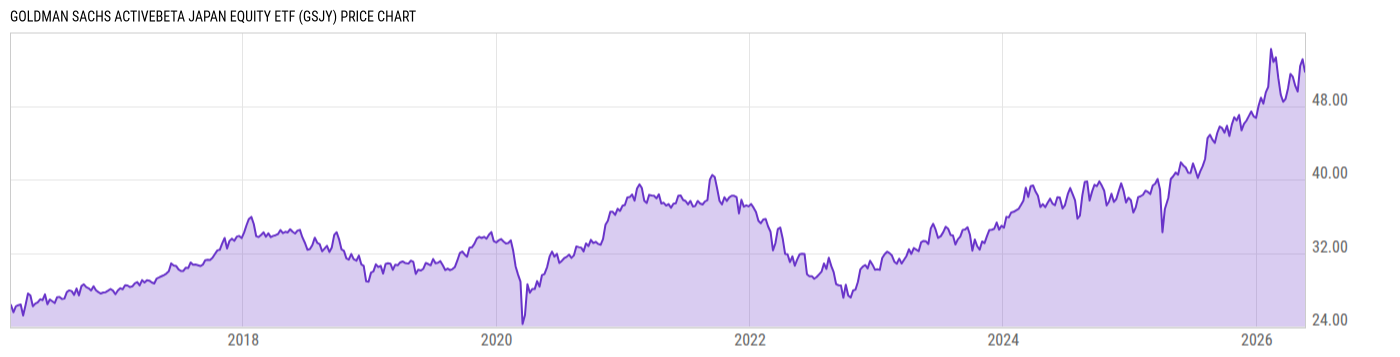
Key Stats

Expense Ratio Discount or Premium to NAV Total Assets Under Management 30-Day Average Daily Volume
0.25% -0.45% 12.60M 1440.97
Dividend Yield Turnover Ratio 1 Year Fund Level Flows Max Drawdown (All)
2.05% 21.00% 0.00 Upgrade

Basic Info

Investment Strategy
The investment seeks to provide investment results that closely correspond, before fees and expenses, to the performance of the Goldman Sachs ActiveBeta® Japan Equity Index (the "index"). The index is designed to deliver exposure to equity securities of Japanese issuers. The fund seeks to achieve its investment objective by investing at least 80% of its assets (exclusive of collateral held from securities lending) in securities included in its underlying index, in depositary receipts representing securities included in its underlying index and in underlying stocks in respect of depositary receipts included in its underlying index.
General
Security Type Exchange-Traded Fund
Equity Style Large Cap/Blend
Fixed Income Style --
Broad Asset Class International Equity
Broad Category Equity
Category Name Japan Stock
Category Index MSCI Japan NR USD
Global Category Name Japan Equity
YCharts Categorization Japan Equity
YCharts Benchmark MSCI Japan Total Return (^MSJPTR)
Prospectus Objective Pacific Stock
Fund Owner Firm Name Goldman Sachs
Prospectus Benchmark Index
Goldman Sachs ActiveBeta Japan NR USD 100.0%
Broad Asset Class Benchmark Index
^MSACXUSNTR 100.0%
Manager Tenure
Raj Garigipati 7.00 yrs

Net Fund Flows Versus Category

View Net Fund Flows. Upgrade now.
1M
3M
6M
YTD
1Y
3Y
5Y
10Y
 
80.00B
60.00B
40.00B
20.00B
0
-20.00B
1 Month
% Rank: --
-- Category Low
-- Category High
1 Year
% Rank: 31
0.00
-658.77M Category Low
316.38M Category High
3 Months
% Rank: --
-- Category Low
-- Category High
3 Years
% Rank: --
-- Category Low
-- Category High
6 Months
% Rank: --
-- Category Low
-- Category High
5 Years
% Rank: --
-- Category Low
-- Category High
YTD
% Rank: --
-- Category Low
-- Category High
10 Years
% Rank: --
-- Category Low
-- Category High
As of February 28, 2023

Performance Versus Category

 
20%
15%
10%
5%
0
View Category Returns. Upgrade now.
Name
1M
3M
YTD
1Y
3Y
5Y
10Y
15Y
Total Return (Price)
--
--
--
--
--
--
--
--
Total Return (NAV)
--
--
--
--
--
--
--
--
Category Rtn. (NAV)
--
--
--
--
--
--
--
--
% Rank in Cat (NAV)
--
--
--
--
--
--
--
--
As of March 24, 2023. Returns for periods of 1 year and above are annualized.

Annual Total Returns Versus Peers

Loading chart...
Name
2016
2017
2018
2019
2020
2021
2022
YTD
--
25.50%
-11.52%
18.30%
13.83%
0.40%
-16.16%
3.94%
4.50%
27.19%
-14.20%
21.51%
10.65%
7.82%
-16.00%
3.25%
3.02%
24.40%
-14.87%
19.40%
15.12%
0.17%
-16.29%
4.61%
-1.01%
21.24%
-14.81%
20.86%
10.56%
13.03%
-4.20%
5.83%
-1.01%
21.48%
-14.67%
20.80%
10.28%
12.78%
-4.00%
5.70%
2.78%
24.27%
-14.09%
19.33%
15.41%
1.16%
-17.72%
4.94%
As of March 24, 2023.

Fundamentals

General
Distribution Yield Upgrade
Dividend Yield TTM (3-24-23) 2.05%
30-Day SEC Yield (2-28-23) Upgrade
7-Day SEC Yield --
Number of Holdings Upgrade
Stock
Weighted Average PE Ratio 11.97
Weighted Average Price to Sales Ratio Upgrade
Weighted Average Price to Book Ratio Upgrade
Weighted Median ROE Upgrade
Weighted Median ROA Upgrade
Forecasted Dividend Yield Upgrade
Forecasted PE Ratio Upgrade
Forecasted Price to Sales Ratio Upgrade
Forecasted Price to Book Ratio Upgrade
As of March 24, 2023

Growth Estimates

Forecasted 5 Yr Earnings Growth Upgrade
Forecasted Book Value Growth Upgrade
Forecasted Cash Flow Growth Upgrade
Forecasted Earnings Growth Upgrade
Forecasted Revenue Growth Upgrade
As of March 24, 2023

Asset Allocation

As of March 24, 2023.
Type % Net % Long % Short
Cash 0.00% Upgrade Upgrade
Stock 100.00% Upgrade Upgrade
Bond 0.00% Upgrade Upgrade
Convertible 0.00% Upgrade Upgrade
Preferred 0.00% Upgrade Upgrade
Other 0.00% Upgrade Upgrade

Top 10 Holdings

Name % Weight Price % Change
Toyota Motor Corp 3.50% 13.58 0.18%
Sony Group Corp 2.49% 87.75 -0.35%
Keyence Corp 2.16% 472.50 -0.10%
Honda Motor Co Ltd 1.90% 25.52 -0.23%
Mitsubishi Corp 1.85% 35.00 -1.74%
Takeda Pharmaceutical Co Ltd 1.78% 32.74 0.00%
Mitsubishi UFJ Financial Group Inc 1.68% 6.26 -1.88%
Daiichi Sankyo Co Ltd 1.66% 35.78 1.07%
Mitsui & Co Ltd 1.62% 29.00 0.00%
Nippon Telegraph & Telephone Corp 1.53% 30.50 0.16%

Basic Info

Investment Strategy
The investment seeks to provide investment results that closely correspond, before fees and expenses, to the performance of the Goldman Sachs ActiveBeta® Japan Equity Index (the "index"). The index is designed to deliver exposure to equity securities of Japanese issuers. The fund seeks to achieve its investment objective by investing at least 80% of its assets (exclusive of collateral held from securities lending) in securities included in its underlying index, in depositary receipts representing securities included in its underlying index and in underlying stocks in respect of depositary receipts included in its underlying index.
General
Security Type Exchange-Traded Fund
Equity Style Large Cap/Blend
Fixed Income Style --
Broad Asset Class International Equity
Broad Category Equity
Category Name Japan Stock
Category Index MSCI Japan NR USD
Global Category Name Japan Equity
YCharts Categorization Japan Equity
YCharts Benchmark MSCI Japan Total Return (^MSJPTR)
Prospectus Objective Pacific Stock
Fund Owner Firm Name Goldman Sachs
Prospectus Benchmark Index
Goldman Sachs ActiveBeta Japan NR USD 100.0%
Broad Asset Class Benchmark Index
^MSACXUSNTR 100.0%
Manager Tenure
Raj Garigipati 7.00 yrs

Fundamentals

General
Distribution Yield Upgrade
Dividend Yield TTM (3-24-23) 2.05%
30-Day SEC Yield (2-28-23) Upgrade
7-Day SEC Yield --
Number of Holdings Upgrade
Stock
Weighted Average PE Ratio 11.97
Weighted Average Price to Sales Ratio Upgrade
Weighted Average Price to Book Ratio Upgrade
Weighted Median ROE Upgrade
Weighted Median ROA Upgrade
Forecasted Dividend Yield Upgrade
Forecasted PE Ratio Upgrade
Forecasted Price to Sales Ratio Upgrade
Forecasted Price to Book Ratio Upgrade
As of March 24, 2023

Growth Estimates

Forecasted 5 Yr Earnings Growth Upgrade
Forecasted Book Value Growth Upgrade
Forecasted Cash Flow Growth Upgrade
Forecasted Earnings Growth Upgrade
Forecasted Revenue Growth Upgrade
As of March 24, 2023

Fund Details

Key Dates
Inception Date 3/2/2016
Last Annual Report Date 8/31/2022
Last Prospectus Date 12/29/2022
Attributes
Index Fund Yes
Inverse Fund No
Leveraged Fund No
Fund of Funds No
Currency Hedged Fund No
Synthetic Replication Fund No
Has Dividend Investment Plan No
Socially Responsible Fund No

Top Portfolio Holders

0 of 0