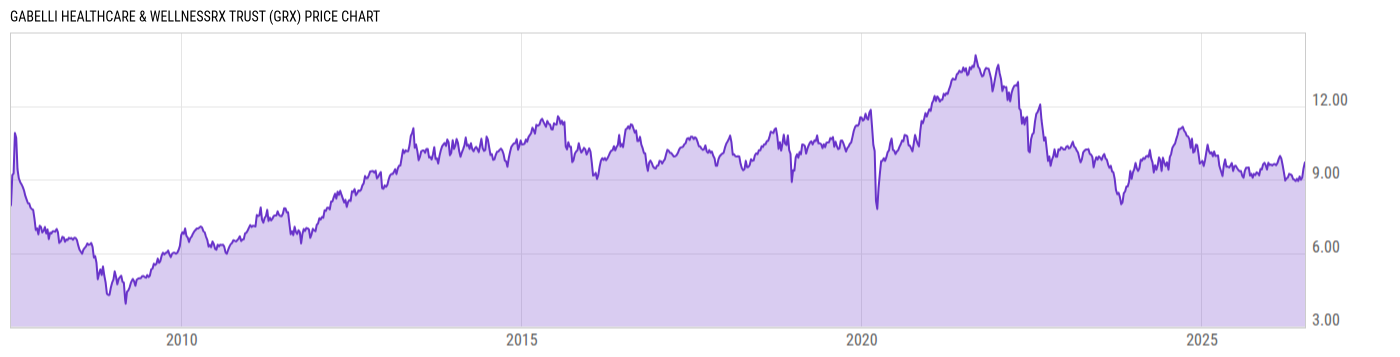
Key Stats

Expense Ratio Discount or Premium to NAV Total Assets Under Management 30-Day Average Daily Volume
3.11% -16.05% 200.33M 29473.77
Dividend Yield Turnover Ratio 1 Year Fund Level Flows Max Drawdown (All)
6.10% 14.00% 18.85M Upgrade

Basic Info

Investment Strategy
The Fund's investment objective is long term growth of capital. The Fund will invest at least 80% of its assets, under normal market conditions, in equity securities and income producing securities of domestic and foreign companies in the healthcare and wellness industries.
General
Security Type Closed-End Fund
Equity Style Mid Cap/Blend
Fixed Income Style --
Broad Asset Class Sector Equity
Broad Category Equity
Category Name Health
Category Index S&P 1500 Health Care TR
Global Category Name Healthcare Sector Equity
YCharts Categorization Healthcare Equity
YCharts Benchmark S&P 1500 Health Care (Sector) Total Return (^SP15HCSTR)
Prospectus Objective Specialty - Health
Fund Owner Firm Name Gabelli
Prospectus Benchmark Index
S&P Health Care Select Sector TR USD 100.0%
Broad Asset Class Benchmark Index
^MSWNTR 100.0%
Manager Tenure
Mario Gabelli 15.68 yrs
Jeffrey Jonas 12.71 yrs
Kevin Dreyer 12.71 yrs
Jennie Tsai 2.16 yrs
Sara Wojda 2.16 yrs

Net Fund Flows Versus Category

View Net Fund Flows. Upgrade now.
1M
3M
6M
YTD
1Y
3Y
5Y
10Y
 
80.00B
60.00B
40.00B
20.00B
0
-20.00B
1 Month
% Rank: --
-- Category Low
-- Category High
1 Year
% Rank: 14
18.85M
-2.719B Category Low
6.230B Category High
3 Months
% Rank: --
-- Category Low
-- Category High
3 Years
% Rank: --
-- Category Low
-- Category High
6 Months
% Rank: --
-- Category Low
-- Category High
5 Years
% Rank: --
-- Category Low
-- Category High
YTD
% Rank: --
-- Category Low
-- Category High
10 Years
% Rank: --
-- Category Low
-- Category High
As of January 31, 2012

Performance Versus Category

 
20%
15%
10%
5%
0
View Category Returns. Upgrade now.
Name
1M
3M
YTD
1Y
3Y
5Y
10Y
15Y
Total Return (Price)
--
--
--
--
--
--
--
--
Total Return (NAV)
--
--
--
--
--
--
--
--
Category Rtn. (NAV)
--
--
--
--
--
--
--
--
% Rank in Cat (NAV)
--
--
--
--
--
--
--
--
As of March 28, 2023. Returns for periods of 1 year and above are annualized.

Annual Total Returns Versus Peers

Loading chart...
Name
2016
2017
2018
2019
2020
2021
2022
YTD
-3.07%
15.05%
-5.75%
31.28%
10.04%
22.01%
-19.96%
-2.89%
7.51%
22.40%
-8.71%
27.67%
15.90%
21.82%
-18.14%
4.30%
-19.24%
15.30%
-1.76%
4.65%
11.31%
14.58%
-2.16%
-4.61%
-23.20%
12.05%
-15.32%
25.62%
14.68%
-10.53%
-9.83%
-0.75%
-2.99%
21.86%
3.46%
22.66%
15.22%
33.42%
-17.50%
-6.43%
-10.41%
16.95%
-5.35%
32.96%
26.39%
12.09%
-1.13%
-6.72%
As of March 28, 2023.

Fundamentals

General
Distribution Yield Upgrade
Dividend Yield TTM (3-28-23) 6.10%
30-Day SEC Yield --
7-Day SEC Yield --
Number of Holdings Upgrade
Stock
Weighted Average PE Ratio 19.80
Weighted Average Price to Sales Ratio Upgrade
Weighted Average Price to Book Ratio Upgrade
Weighted Median ROE Upgrade
Weighted Median ROA Upgrade
Forecasted Dividend Yield Upgrade
Forecasted PE Ratio Upgrade
Forecasted Price to Sales Ratio Upgrade
Forecasted Price to Book Ratio Upgrade
As of December 31, 2022

Growth Estimates

Forecasted 5 Yr Earnings Growth Upgrade
Forecasted Book Value Growth Upgrade
Forecasted Cash Flow Growth Upgrade
Forecasted Earnings Growth Upgrade
Forecasted Revenue Growth Upgrade
As of December 31, 2022

Asset Allocation

As of December 31, 2022.
Type % Net % Long % Short
Cash 5.64% Upgrade Upgrade
Stock 94.31% Upgrade Upgrade
Bond 0.00% Upgrade Upgrade
Convertible 0.00% Upgrade Upgrade
Preferred 0.05% Upgrade Upgrade
Other 0.00% Upgrade Upgrade

Top 10 Holdings

Name % Weight Price % Change
CVS Health Corp 3.84% 73.12 -0.61%
Nestle SA 3.16% 119.95 0.34%
United States Treasury Bills 4.19281%
2.87% -- --
AbbVie Inc 2.87% 158.25 0.45%
The Cigna Group 2.79% 256.50 -2.02%
Johnson & Johnson 2.69% 151.82 -0.97%
HCA Healthcare Inc 2.47% 254.48 0.03%
Tenet Healthcare Corp 2.14% 54.96 -0.38%
Chemed Corp 2.11% 528.99 0.49%
Option Care Health Inc 2.05% 31.65 0.29%

Basic Info

Investment Strategy
The Fund's investment objective is long term growth of capital. The Fund will invest at least 80% of its assets, under normal market conditions, in equity securities and income producing securities of domestic and foreign companies in the healthcare and wellness industries.
General
Security Type Closed-End Fund
Equity Style Mid Cap/Blend
Fixed Income Style --
Broad Asset Class Sector Equity
Broad Category Equity
Category Name Health
Category Index S&P 1500 Health Care TR
Global Category Name Healthcare Sector Equity
YCharts Categorization Healthcare Equity
YCharts Benchmark S&P 1500 Health Care (Sector) Total Return (^SP15HCSTR)
Prospectus Objective Specialty - Health
Fund Owner Firm Name Gabelli
Prospectus Benchmark Index
S&P Health Care Select Sector TR USD 100.0%
Broad Asset Class Benchmark Index
^MSWNTR 100.0%
Manager Tenure
Mario Gabelli 15.68 yrs
Jeffrey Jonas 12.71 yrs
Kevin Dreyer 12.71 yrs
Jennie Tsai 2.16 yrs
Sara Wojda 2.16 yrs

Fundamentals

General
Distribution Yield Upgrade
Dividend Yield TTM (3-28-23) 6.10%
30-Day SEC Yield --
7-Day SEC Yield --
Number of Holdings Upgrade
Stock
Weighted Average PE Ratio 19.80
Weighted Average Price to Sales Ratio Upgrade
Weighted Average Price to Book Ratio Upgrade
Weighted Median ROE Upgrade
Weighted Median ROA Upgrade
Forecasted Dividend Yield Upgrade
Forecasted PE Ratio Upgrade
Forecasted Price to Sales Ratio Upgrade
Forecasted Price to Book Ratio Upgrade
As of December 31, 2022

Growth Estimates

Forecasted 5 Yr Earnings Growth Upgrade
Forecasted Book Value Growth Upgrade
Forecasted Cash Flow Growth Upgrade
Forecasted Earnings Growth Upgrade
Forecasted Revenue Growth Upgrade
As of December 31, 2022

Fund Details

Key Dates
Inception Date 6/19/2007
Last Annual Report Date 12/31/2022
Last Prospectus Date 12/31/2013
Attributes
Index Fund No
Inverse Fund No
Leveraged Fund Yes
Fund of Funds No
Currency Hedged Fund No
Synthetic Replication Fund No
Has Dividend Investment Plan Yes
Socially Responsible Fund No

Top Portfolio Holders

0 of 0