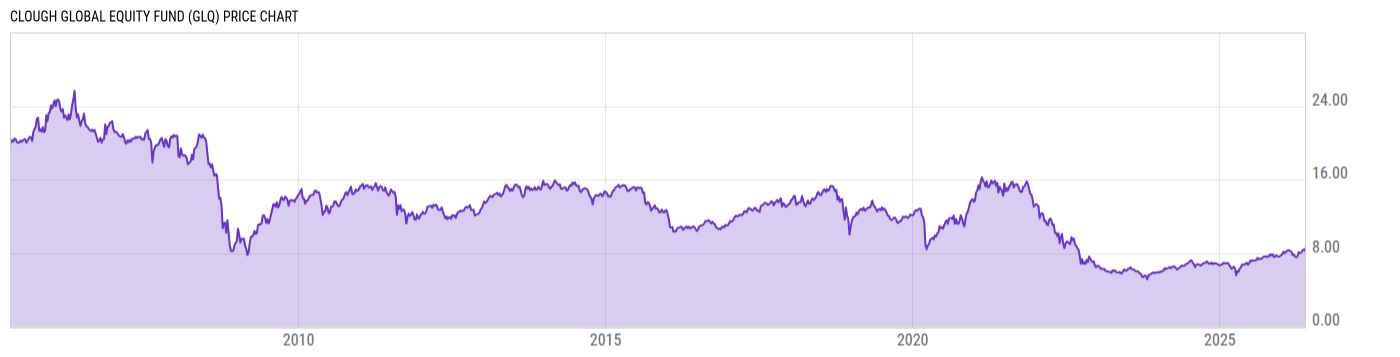
Clough Global Equity Fund (GLQ)
5.83
-0.05
(-0.85%)
USD |
NYAM |
Mar 28, 16:00
5.84
+0.01
(+0.17%)
After-Hours: 20:00
Key Stats
Expense Ratio | Discount or Premium to NAV | Total Assets Under Management | 30-Day Average Daily Volume |
---|---|---|---|
4.39% | -15.99% | 133.11M | 88014.43 |
Dividend Yield | Turnover Ratio | 1 Year Fund Level Flows | Max Drawdown (All) |
0.00% | 198.0% | -22.50M | Upgrade |
Basic Info
Investment Strategy | |
The Fund's investment objective is to provide a high level of total return. The Fund seeksto pursue this objective by applying a fundamental research‐ driven investment process and will under normal circumstances invest at least 80% of its net assets, including any borrowings for investment purposes, in equity securities in both U.S. and non‐U.S. markets of companies of any market capitalization. |
General | |
Security Type | Closed-End Fund |
Equity Style | Large Cap/Blend |
Fixed Income Style | -- |
Broad Asset Class | International Equity |
Broad Category | Equity |
Category Name | Global Large-Stock Blend |
Category Index | MSCI ACWI NR USD |
Global Category Name | Global Equity Large Cap |
YCharts Categorization | Global Equity Large Cap |
YCharts Benchmark | MSCI ACWI Ex USA Total Return (^MSACXUSTR) |
Prospectus Objective | World Stock |
Fund Owner Firm Name | Clough Capital Partners L.P. |
Prospectus Benchmark Index | |
MSCI World Index TR | 100.0% |
Broad Asset Class Benchmark Index | |
^MSACXUSNTR | 100.0% |
Manager Tenure | |
Charles Clough | 17.85 yrs |
Net Fund Flows Versus Category
1 Month
% Rank:
--
--
Category Low
--
Category High
1 Year
% Rank:
55
-22.50M
-3.563B
Category Low
4.081B
Category High
3 Months
% Rank:
--
--
Category Low
--
Category High
3 Years
% Rank:
--
--
Category Low
--
Category High
6 Months
% Rank:
--
--
Category Low
--
Category High
5 Years
% Rank:
--
--
Category Low
--
Category High
YTD
% Rank:
--
--
Category Low
--
Category High
10 Years
% Rank:
--
--
Category Low
--
Category High
As of January 31, 2012
Risk
Performance Versus Category
As of March 28, 2023. Returns for periods of 1 year and above are annualized.
Annual Total Returns Versus Peers
As of March 28, 2023.
Asset Allocation
Top 10 Holdings
Name | % Weight | Price | % Change |
---|---|---|---|
United States Treasury Notes 0.88%
|
4.86% | -- | -- |
United States Treasury Notes 3.25%
|
4.53% | -- | -- |
United States Treasury Notes 0.75%
|
4.52% | -- | -- |
Airbus SE | 4.28% | 127.30 | 0.24% |
Northrop Grumman Corp | 3.93% | 459.00 | 0.16% |
United States Treasury Notes 2.5%
|
3.51% | -- | -- |
HDFC Bank Ltd ADR | 3.34% | 64.86 | 0.75% |
TransDigm Group Inc | 3.32% | 719.79 | 0.86% |
Raytheon Technologies Corp | 3.28% | 96.80 | -0.11% |
Microsoft Corp | 3.23% | 275.23 | -0.42% |
News
Headline
Wire
Time (ET)
PR Newswire
01/10 17:00
PR Newswire
10/11 06:00
PR Newswire
08/31 06:00
Basic Info
Investment Strategy | |
The Fund's investment objective is to provide a high level of total return. The Fund seeksto pursue this objective by applying a fundamental research‐ driven investment process and will under normal circumstances invest at least 80% of its net assets, including any borrowings for investment purposes, in equity securities in both U.S. and non‐U.S. markets of companies of any market capitalization. |
General | |
Security Type | Closed-End Fund |
Equity Style | Large Cap/Blend |
Fixed Income Style | -- |
Broad Asset Class | International Equity |
Broad Category | Equity |
Category Name | Global Large-Stock Blend |
Category Index | MSCI ACWI NR USD |
Global Category Name | Global Equity Large Cap |
YCharts Categorization | Global Equity Large Cap |
YCharts Benchmark | MSCI ACWI Ex USA Total Return (^MSACXUSTR) |
Prospectus Objective | World Stock |
Fund Owner Firm Name | Clough Capital Partners L.P. |
Prospectus Benchmark Index | |
MSCI World Index TR | 100.0% |
Broad Asset Class Benchmark Index | |
^MSACXUSNTR | 100.0% |
Manager Tenure | |
Charles Clough | 17.85 yrs |
Fundamentals
General | |
Distribution Yield | Upgrade |
Dividend Yield TTM (3-28-23) | 0.00% |
30-Day SEC Yield | -- |
7-Day SEC Yield | -- |
Number of Holdings | Upgrade |
Stock | |
Weighted Average PE Ratio | 18.92 |
Weighted Average Price to Sales Ratio | Upgrade |
Weighted Average Price to Book Ratio | Upgrade |
Weighted Median ROE | Upgrade |
Weighted Median ROA | Upgrade |
Forecasted Dividend Yield | Upgrade |
Forecasted PE Ratio | Upgrade |
Forecasted Price to Sales Ratio | Upgrade |
Forecasted Price to Book Ratio | Upgrade |
Bond | |
Current Yield | 2.16% |
Yield to Maturity | -- |
Effective Duration | -- |
Average Coupon | Upgrade |
Average Credit Score | Upgrade |
Average Price | Upgrade |
As of January 31, 2023
Fund Details
Key Dates | |
Inception Date | 4/27/2005 |
Last Annual Report Date | 10/31/2022 |
Last Prospectus Date | 4/27/2005 |
Attributes | |
Index Fund | No |
Inverse Fund | No |
Leveraged Fund |
|
Fund of Funds | No |
Currency Hedged Fund | No |
Synthetic Replication Fund | No |
Has Dividend Investment Plan |
|
Socially Responsible Fund | No |
News
Headline
Wire
Time (ET)
PR Newswire
01/10 17:00
PR Newswire
10/11 06:00
PR Newswire
08/31 06:00