

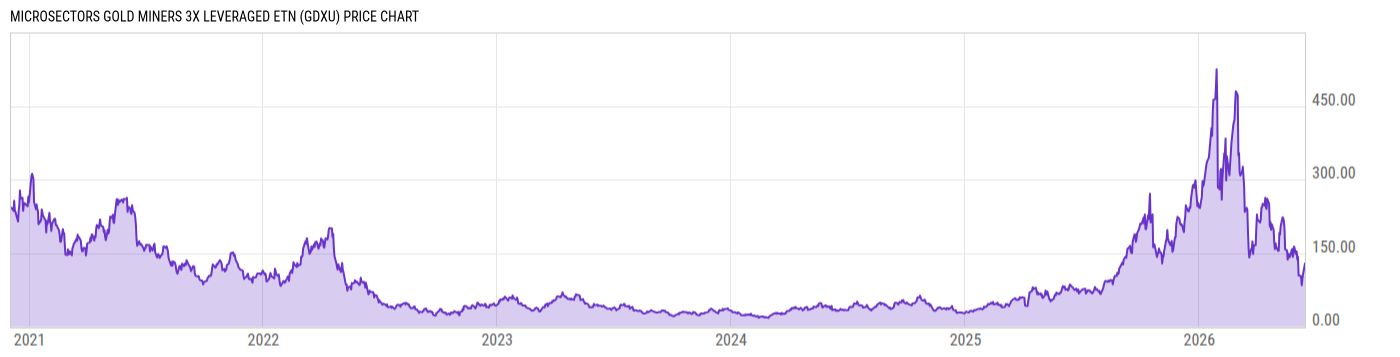
MicroSectors Gold Miners 3X Leveraged ETN (GDXU)
84.16
-14.56
(-14.75%)
USD |
NYSEARCA |
Jun 10, 16:00
82.00
-2.16
(-2.57%)
After-Hours: 20:00
Price Chart
Key Stats
| Net Expense Ratio | Discount or Premium to NAV | Total Assets Under Management | 30-Day Average Daily Volume |
|---|---|---|---|
| 0.95% | 0.08% | 838.88M | 1.314M |
| Weighted Average Dividend Yield | Turnover Ratio (Generic) | 1 Year Fund Level Flows | Max Drawdown (Since Inception) |
| -- | -- | -2.651M |
Basic Info
| Investment Strategy | |
| The Fund seeks the return on the notes to be linked to a three times leveraged participation in the performance of the S-Network MicroSectors Gold Miners Index. The Index currently tracks the performance of two exchange traded funds, the VanEck Vectors Gold Miners ETF and the VanEck Vectors Junior Gold Miners ETF. |
| General | |
| Security Type | Exchange-Traded Fund |
| Equity Style | -- |
| Broad Asset Class | Miscellaneous |
| Broad Category | Alternative Strategies |
| Global Peer Group | Alternative Equity Leveraged |
| Peer Group | Equity Leverage Funds |
| Global Macro | Alternative Equity |
| US Macro | Large-Cap Funds |
| YCharts Categorization | -- |
| YCharts Benchmark | -- |
| Prospectus Objective | Equity Leverage Funds |
| Fund Owner Firm Name | BMO Global Asset Management |
| Broad Asset Class Benchmark Index | |
| ^SPXTR | 100.0% |
Performance Versus Peer Group
Annual Total Returns Versus Peers
As of June 11, 2026.
Asset Allocation
| Type | % Net |
|---|
Basic Info
| Investment Strategy | |
| The Fund seeks the return on the notes to be linked to a three times leveraged participation in the performance of the S-Network MicroSectors Gold Miners Index. The Index currently tracks the performance of two exchange traded funds, the VanEck Vectors Gold Miners ETF and the VanEck Vectors Junior Gold Miners ETF. |
| General | |
| Security Type | Exchange-Traded Fund |
| Equity Style | -- |
| Broad Asset Class | Miscellaneous |
| Broad Category | Alternative Strategies |
| Global Peer Group | Alternative Equity Leveraged |
| Peer Group | Equity Leverage Funds |
| Global Macro | Alternative Equity |
| US Macro | Large-Cap Funds |
| YCharts Categorization | -- |
| YCharts Benchmark | -- |
| Prospectus Objective | Equity Leverage Funds |
| Fund Owner Firm Name | BMO Global Asset Management |
| Broad Asset Class Benchmark Index | |
| ^SPXTR | 100.0% |