

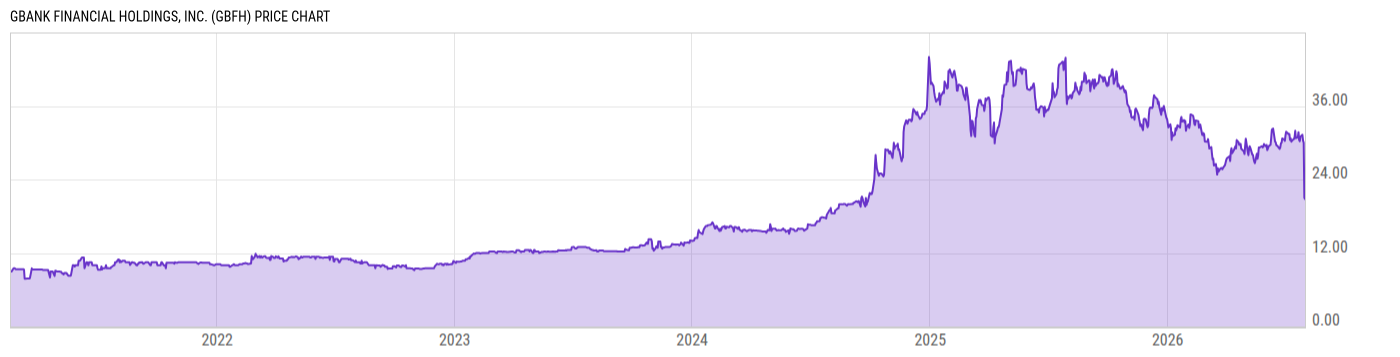
GBank Financial Holdings, Inc. (GBFH)
20.82
-0.20
(-0.95%)
USD |
NASDAQ |
Jul 31, 16:00
20.77
-0.05
(-0.24%)
After-Hours: 20:00
Price Chart
Key Stats
| Price and Performance | |
|---|---|
| Market Cap | 301.27M |
| 52 Week High (Daily) | |
| 52 Week Low (Daily) | |
| All-Time High (Daily) | |
| Year to Date Total Returns (Daily) | |
| 1 Month Total Returns (Daily) | |
| 1 Year Total Returns (Daily) | -44.53% |
| Valuation | |
| PE Ratio | 16.31 |
| PE Ratio (Forward) | |
| PS Ratio | 2.520 |
| Price to Book Value | 1.743 |
| EV to EBITDA | |
| Dividend | |
|---|---|
| Dividend | -- |
| Dividend Yield (Forward) | |
| Financials | |
| Revenue (5 Year Growth) | |
| Revenue (Quarterly YoY Growth) | |
| EPS Diluted (5 Year Growth) | |
| EPS Diluted (Quarterly YoY Growth) | |
| Debt to Equity Ratio | 0.2066 |
| Return on Equity | |
| Return on Assets | |
| Risk | |
| Beta (5Y) | |
| Max Drawdown (5Y) | 52.68% |
Profile
| GBank Financial Holdings, Inc. operates as a bank holding company. The company was founded in 2007 and is headquartered in Las Vegas, NV. |
| URL | http://www.gbankfinancialholdings.com |
| Investor Relations URL | N/A |
| HQ State/Province | Nevada |
| Sector | Financials |
| Industry | Banks |
| Equity Style | Small Cap Core |
| Next Earnings Release | Oct. 27, 2026 (est.) |
| Last Earnings Release | Jul. 29, 2026 |
| Next Ex-Dividend Date | N/A |
| Last Ex-Dividend Date | N/A |