

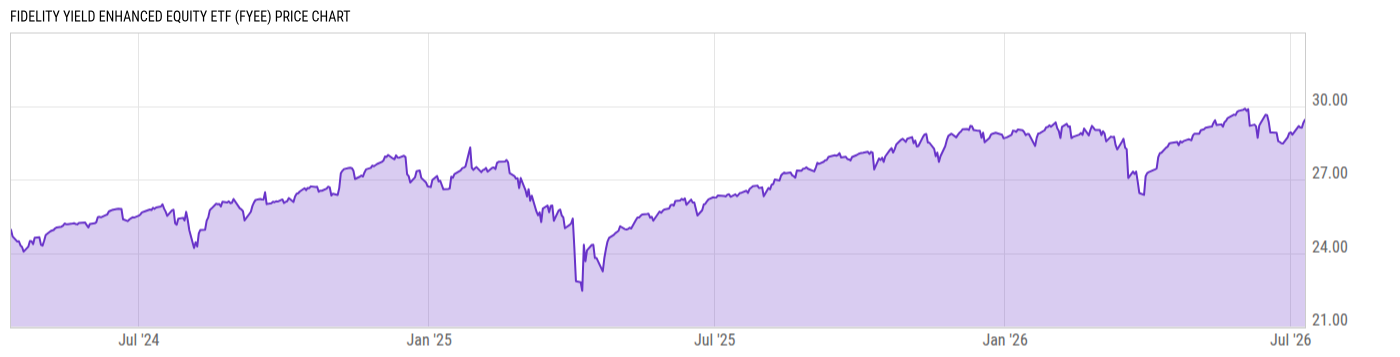
Fidelity Yield Enhanced Equity ETF (FYEE)
29.44
+0.12
(+0.41%)
USD |
BATS |
Jul 10, 16:00
29.44
0.00 (0.00%)
Pre-Market: 20:00
Price Chart
Key Stats
| Net Expense Ratio | Discount or Premium to NAV | Total Assets Under Management | 30-Day Average Daily Volume |
|---|---|---|---|
| 0.28% | 0.11% | 205.11M | 77415.60 |
| Weighted Average Dividend Yield | Turnover Ratio (Generic) | 1 Year Fund Level Flows | Max Drawdown (Since Inception) |
| 0.94% | 90.00% | 168.58M |
Basic Info
| Investment Strategy | |
| The Fund seeks current income while maintaining prospects for capital appreciation. Under normal circumstances, the Fund will invest at least 80% of assets in equity securities. Equity securities of companies with market capitalizations generally similar to companies in the S&P 500 Index or Russell 1000 Index. |
| General | |
| Security Type | Exchange-Traded Fund |
| Equity Style | Large Cap Core |
| Broad Asset Class | International Equity |
| Broad Category | Equity |
| Global Peer Group | Equity Global |
| Peer Group | Global Large-Cap Core |
| Global Macro | Equity Global |
| US Macro | Developed Global Markets Funds |
| YCharts Categorization | -- |
| YCharts Benchmark | -- |
| Prospectus Objective | Global Funds |
| Fund Owner Firm Name | Fidelity Investments |
| Broad Asset Class Benchmark Index | |
| ^MSACXUSNTR | 100.0% |
Performance Versus Peer Group
Annual Total Returns Versus Peers
As of July 12, 2026.
Asset Allocation
As of June 30, 2026.
| Type | % Net |
|---|---|
| Cash | 1.26% |
| Stock | 97.39% |
| Bond | 1.69% |
| Convertible | 0.00% |
| Preferred | 0.00% |
| Other | -0.34% |
Basic Info
| Investment Strategy | |
| The Fund seeks current income while maintaining prospects for capital appreciation. Under normal circumstances, the Fund will invest at least 80% of assets in equity securities. Equity securities of companies with market capitalizations generally similar to companies in the S&P 500 Index or Russell 1000 Index. |
| General | |
| Security Type | Exchange-Traded Fund |
| Equity Style | Large Cap Core |
| Broad Asset Class | International Equity |
| Broad Category | Equity |
| Global Peer Group | Equity Global |
| Peer Group | Global Large-Cap Core |
| Global Macro | Equity Global |
| US Macro | Developed Global Markets Funds |
| YCharts Categorization | -- |
| YCharts Benchmark | -- |
| Prospectus Objective | Global Funds |
| Fund Owner Firm Name | Fidelity Investments |
| Broad Asset Class Benchmark Index | |
| ^MSACXUSNTR | 100.0% |