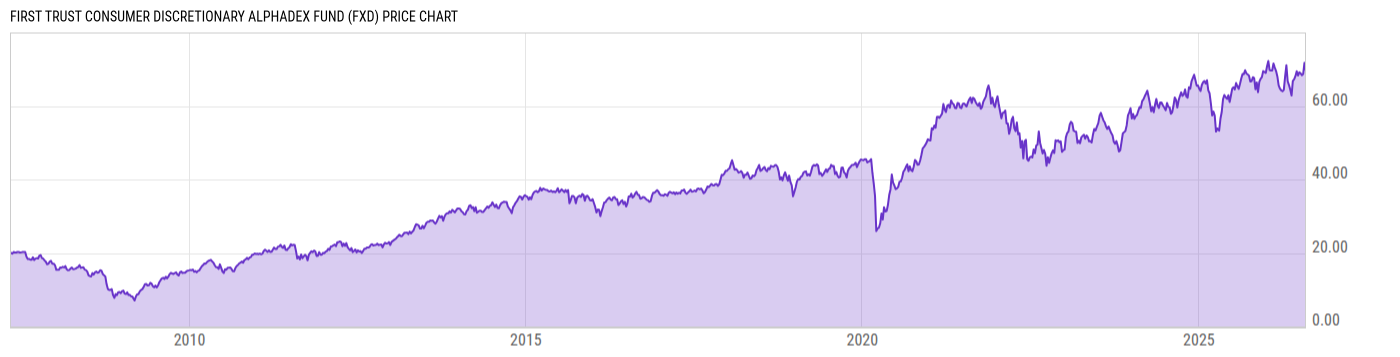
Key Stats

Expense Ratio Discount or Premium to NAV Total Assets Under Management 30-Day Average Daily Volume
0.61% 0.02% 612.90M 858909.9
Dividend Yield Turnover Ratio 1 Year Fund Level Flows Max Drawdown (All)
1.11% -- -1.107B Upgrade

Basic Info

Investment Strategy
The investment seeks investment results that correspond generally to the price and yield (before the fund's fees and expenses) of an equity index called the StrataQuant® Consumer Discretionary Index. The fund will normally invest at least 90% of its net assets (including investment borrowings) in the common stocks that comprise the index. The index is a modified equal-dollar weighted index that seeks to objectively identify and select stocks from the Russell 1000® Index in the consumer discretionary sector that may generate positive alpha relative to traditional passive-style indices through the use of the AlphaDEX® selection methodology.
General
Security Type Exchange-Traded Fund
Equity Style Mid Cap/Blend
Fixed Income Style --
Broad Asset Class Sector Equity
Broad Category Equity
Category Name Consumer Cyclical
Category Index S&P 1500 Cons Discretionary TR
Global Category Name Consumer Goods & Services Sector Equity
YCharts Categorization Consumer Services Equity
YCharts Benchmark S&P 1500 Consumer Staples (Sector) Total Return (^SP15CNSSTR)
Prospectus Objective Specialty - Unaligned
Fund Owner Firm Name First Trust
Prospectus Benchmark Index
StrataQuant Consumer Disc TR USD 100.0%
Broad Asset Class Benchmark Index
^MSWNTR 100.0%
Manager Tenure
Daniel Lindquist 15.82 yrs
David McGarel 15.82 yrs
Jon Erickson 15.82 yrs
Roger Testin 15.82 yrs
Stan Ueland 15.82 yrs
Chris Peterson 6.96 yrs
Erik Russo 2.16 yrs

Net Fund Flows Versus Category

View Net Fund Flows. Upgrade now.
1M
3M
6M
YTD
1Y
3Y
5Y
10Y
 
80.00B
60.00B
40.00B
20.00B
0
-20.00B
1 Month
% Rank: --
-- Category Low
-- Category High
1 Year
% Rank: 99
-1.107B
-2.055B Category Low
186.13M Category High
3 Months
% Rank: --
-- Category Low
-- Category High
3 Years
% Rank: --
-- Category Low
-- Category High
6 Months
% Rank: --
-- Category Low
-- Category High
5 Years
% Rank: --
-- Category Low
-- Category High
YTD
% Rank: --
-- Category Low
-- Category High
10 Years
% Rank: --
-- Category Low
-- Category High
As of February 28, 2023

Performance Versus Category

 
20%
15%
10%
5%
0
View Category Returns. Upgrade now.
Name
1M
3M
YTD
1Y
3Y
5Y
10Y
15Y
Total Return (Price)
--
--
--
--
--
--
--
--
Total Return (NAV)
--
--
--
--
--
--
--
--
Category Rtn. (NAV)
--
--
--
--
--
--
--
--
% Rank in Cat (NAV)
--
--
--
--
--
--
--
--
As of March 24, 2023. Returns for periods of 1 year and above are annualized.

Annual Total Returns Versus Peers

Loading chart...
Name
2016
2017
2018
2019
2020
2021
2022
YTD
5.22%
19.77%
-11.59%
24.22%
12.96%
22.71%
-21.57%
2.10%
7.51%
22.40%
-8.71%
27.67%
15.90%
21.82%
-18.14%
3.82%
5.63%
15.04%
-8.78%
25.88%
11.46%
28.76%
-24.03%
2.94%
-3.54%
19.87%
-6.85%
18.05%
38.97%
20.34%
-29.60%
2.95%
5.59%
19.87%
1.77%
27.36%
24.58%
19.65%
-31.78%
8.21%
4.43%
7.61%
1.98%
20.18%
36.01%
10.68%
-36.42%
3.37%
As of March 24, 2023.

Fundamentals

General
Distribution Yield Upgrade
Dividend Yield TTM (3-27-23) 1.11%
30-Day SEC Yield (2-28-23) Upgrade
7-Day SEC Yield --
Number of Holdings Upgrade
Stock
Weighted Average PE Ratio 12.26
Weighted Average Price to Sales Ratio Upgrade
Weighted Average Price to Book Ratio Upgrade
Weighted Median ROE Upgrade
Weighted Median ROA Upgrade
Forecasted Dividend Yield Upgrade
Forecasted PE Ratio Upgrade
Forecasted Price to Sales Ratio Upgrade
Forecasted Price to Book Ratio Upgrade
As of March 26, 2023

Growth Estimates

Forecasted 5 Yr Earnings Growth Upgrade
Forecasted Book Value Growth Upgrade
Forecasted Cash Flow Growth Upgrade
Forecasted Earnings Growth Upgrade
Forecasted Revenue Growth Upgrade
As of March 26, 2023

Asset Allocation

As of March 26, 2023.
Type % Net % Long % Short
Cash 0.19% Upgrade Upgrade
Stock 99.81% Upgrade Upgrade
Bond 0.00% Upgrade Upgrade
Convertible 0.00% Upgrade Upgrade
Preferred 0.00% Upgrade Upgrade
Other 0.00% Upgrade Upgrade

Top 10 Holdings

Name % Weight Price % Change
Wynn Resorts Ltd 1.78% 106.34 -0.23%
PulteGroup Inc 1.71% 56.55 -0.19%
Paramount Global Class B 1.65% 20.76 2.62%
Toll Brothers Inc 1.61% 58.49 0.12%
AutoNation Inc 1.59% 127.42 2.25%
Penske Automotive Group Inc 1.59% 134.35 1.15%
Lennar Corp Class A 1.57% 102.18 -1.50%
Deckers Outdoor Corp 1.52% 448.14 1.22%
Ulta Beauty Inc 1.51% 520.45 1.26%
D.R. Horton Inc 1.49% 95.29 -1.69%

Basic Info

Investment Strategy
The investment seeks investment results that correspond generally to the price and yield (before the fund's fees and expenses) of an equity index called the StrataQuant® Consumer Discretionary Index. The fund will normally invest at least 90% of its net assets (including investment borrowings) in the common stocks that comprise the index. The index is a modified equal-dollar weighted index that seeks to objectively identify and select stocks from the Russell 1000® Index in the consumer discretionary sector that may generate positive alpha relative to traditional passive-style indices through the use of the AlphaDEX® selection methodology.
General
Security Type Exchange-Traded Fund
Equity Style Mid Cap/Blend
Fixed Income Style --
Broad Asset Class Sector Equity
Broad Category Equity
Category Name Consumer Cyclical
Category Index S&P 1500 Cons Discretionary TR
Global Category Name Consumer Goods & Services Sector Equity
YCharts Categorization Consumer Services Equity
YCharts Benchmark S&P 1500 Consumer Staples (Sector) Total Return (^SP15CNSSTR)
Prospectus Objective Specialty - Unaligned
Fund Owner Firm Name First Trust
Prospectus Benchmark Index
StrataQuant Consumer Disc TR USD 100.0%
Broad Asset Class Benchmark Index
^MSWNTR 100.0%
Manager Tenure
Daniel Lindquist 15.82 yrs
David McGarel 15.82 yrs
Jon Erickson 15.82 yrs
Roger Testin 15.82 yrs
Stan Ueland 15.82 yrs
Chris Peterson 6.96 yrs
Erik Russo 2.16 yrs

Fundamentals

General
Distribution Yield Upgrade
Dividend Yield TTM (3-27-23) 1.11%
30-Day SEC Yield (2-28-23) Upgrade
7-Day SEC Yield --
Number of Holdings Upgrade
Stock
Weighted Average PE Ratio 12.26
Weighted Average Price to Sales Ratio Upgrade
Weighted Average Price to Book Ratio Upgrade
Weighted Median ROE Upgrade
Weighted Median ROA Upgrade
Forecasted Dividend Yield Upgrade
Forecasted PE Ratio Upgrade
Forecasted Price to Sales Ratio Upgrade
Forecasted Price to Book Ratio Upgrade
As of March 26, 2023

Growth Estimates

Forecasted 5 Yr Earnings Growth Upgrade
Forecasted Book Value Growth Upgrade
Forecasted Cash Flow Growth Upgrade
Forecasted Earnings Growth Upgrade
Forecasted Revenue Growth Upgrade
As of March 26, 2023

Fund Details

Key Dates
Inception Date 5/8/2007
Last Annual Report Date 7/31/2022
Last Prospectus Date 12/1/2022
Attributes
Index Fund Yes
Inverse Fund No
Leveraged Fund No
Fund of Funds No
Currency Hedged Fund No
Synthetic Replication Fund No
Has Dividend Investment Plan No
Socially Responsible Fund No

Top Portfolio Holders

0 of 0