

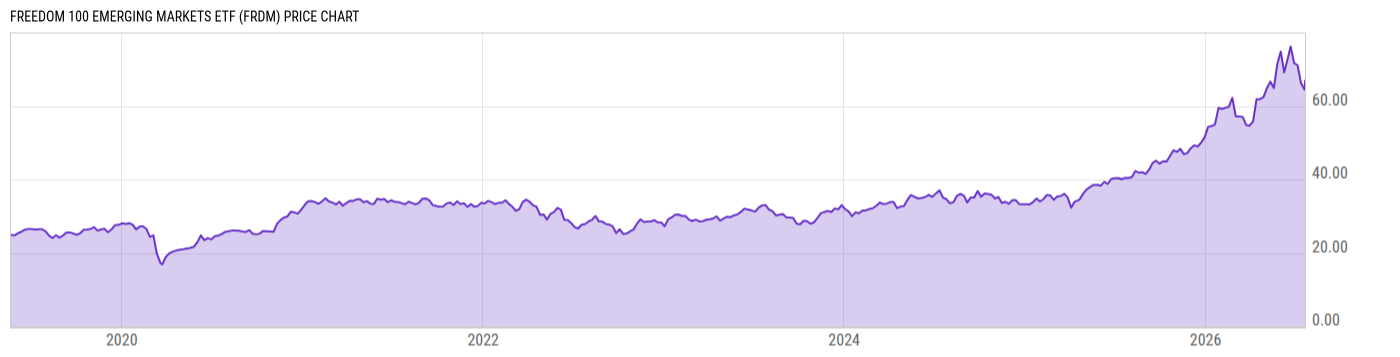
Freedom 100 Emerging Markets ETF (FRDM)
66.85
+2.38
(+3.69%)
USD |
BATS |
Jul 21, 16:00
67.02
+0.17
(+0.25%)
After-Hours: 20:00
Price Chart
Key Stats
| Net Expense Ratio | Discount or Premium to NAV | Total Assets Under Management | 30-Day Average Daily Volume |
|---|---|---|---|
| 0.49% | 0.89% | 3.223B | 343371.9 |
| Weighted Average Dividend Yield | Turnover Ratio (Generic) | 1 Year Fund Level Flows | Max Drawdown (Since Inception) |
| 2.60% | 19.00% | 1.058B |
Basic Info
| Investment Strategy | |
| The Fund seeks to track the total return performance, before fees and expenses, of the Life + Liberty Freedom 100 Emerging Markets Index. The Fund invests, under normal circumstances, at least 80% of its assets in the component securities of the Index or in depositary receipts representing such component securities. |
| General | |
| Security Type | Exchange-Traded Fund |
| Equity Style | Large Cap Value |
| Broad Asset Class | International Equity |
| Broad Category | Equity |
| Global Peer Group | Equity Emerging Markets Global |
| Peer Group | Emerging Markets Funds |
| Global Macro | Equity Emerging Markets |
| US Macro | Emerging Markets Equity Funds |
| YCharts Categorization | -- |
| YCharts Benchmark | -- |
| Prospectus Objective | Emerging Markets Funds |
| Fund Owner Firm Name | Alpha Architect |
| Broad Asset Class Benchmark Index | |
| ^MSACXUSNTR | 100.0% |
Performance Versus Peer Group
Annual Total Returns Versus Peers
As of July 22, 2026.
Asset Allocation
As of June 30, 2026.
| Type | % Net |
|---|---|
| Cash | 0.07% |
| Stock | 99.74% |
| Bond | 0.22% |
| Convertible | 0.00% |
| Preferred | 0.00% |
| Other | -0.04% |
Basic Info
| Investment Strategy | |
| The Fund seeks to track the total return performance, before fees and expenses, of the Life + Liberty Freedom 100 Emerging Markets Index. The Fund invests, under normal circumstances, at least 80% of its assets in the component securities of the Index or in depositary receipts representing such component securities. |
| General | |
| Security Type | Exchange-Traded Fund |
| Equity Style | Large Cap Value |
| Broad Asset Class | International Equity |
| Broad Category | Equity |
| Global Peer Group | Equity Emerging Markets Global |
| Peer Group | Emerging Markets Funds |
| Global Macro | Equity Emerging Markets |
| US Macro | Emerging Markets Equity Funds |
| YCharts Categorization | -- |
| YCharts Benchmark | -- |
| Prospectus Objective | Emerging Markets Funds |
| Fund Owner Firm Name | Alpha Architect |
| Broad Asset Class Benchmark Index | |
| ^MSACXUSNTR | 100.0% |