

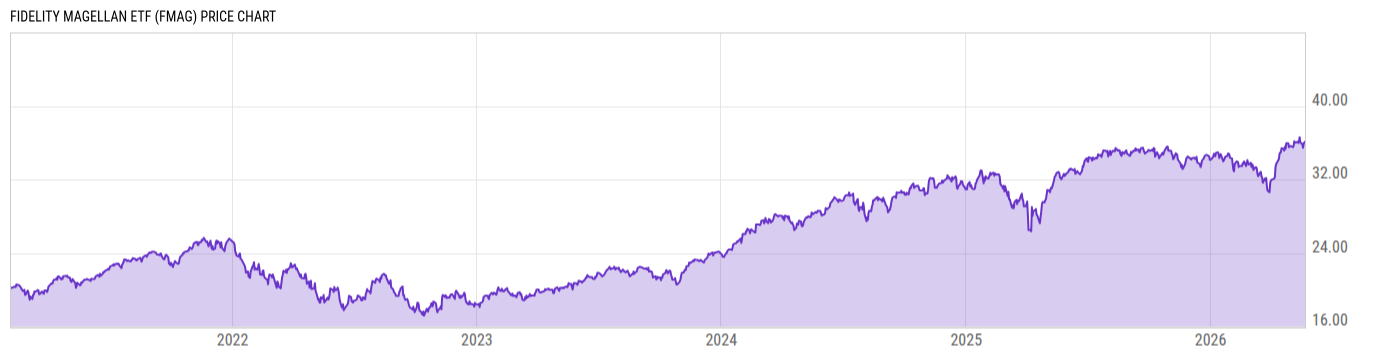
Fidelity Magellan ETF (FMAG)
35.00
-0.85
(-2.37%)
USD |
BATS |
Jun 10, 16:00
34.94
-0.06
(-0.17%)
After-Hours: 19:56
Price Chart
Key Stats
| Net Expense Ratio | Discount or Premium to NAV | Total Assets Under Management | 30-Day Average Daily Volume |
|---|---|---|---|
| 0.57% | 0.12% | 251.55M | 20419.43 |
| Weighted Average Dividend Yield | Turnover Ratio (Generic) | 1 Year Fund Level Flows | Max Drawdown (Since Inception) |
| 0.55% | 70.00% | -6.118M |
Basic Info
| Investment Strategy | |
| The Fund seeks long-term growth of capital. The Fund invests its assets primarily in equity securities. In buying and selling securities for the fund, the Adviser relies on fundamental analysis, which involves a bottom-up assessment of a company's potential for success in light of factors, to select investments. |
| General | |
| Security Type | Exchange-Traded Fund |
| Equity Style | Large Cap Growth |
| Broad Asset Class | US Equity |
| Broad Category | Equity |
| Global Peer Group | Equity US |
| Peer Group | Large-Cap Growth Funds |
| Global Macro | Equity North America |
| US Macro | Large-Cap Funds |
| YCharts Categorization | -- |
| YCharts Benchmark | -- |
| Prospectus Objective | Growth Funds |
| Fund Owner Firm Name | Fidelity Investments |
| Broad Asset Class Benchmark Index | |
| ^SPXTR | 100.0% |
Performance Versus Peer Group
Annual Total Returns Versus Peers
As of June 10, 2026.
Asset Allocation
As of April 30, 2026.
| Type | % Net |
|---|---|
| Cash | 0.00% |
| Stock | 99.90% |
| Bond | 0.00% |
| Convertible | 0.00% |
| Preferred | 0.00% |
| Other | 0.10% |
Basic Info
| Investment Strategy | |
| The Fund seeks long-term growth of capital. The Fund invests its assets primarily in equity securities. In buying and selling securities for the fund, the Adviser relies on fundamental analysis, which involves a bottom-up assessment of a company's potential for success in light of factors, to select investments. |
| General | |
| Security Type | Exchange-Traded Fund |
| Equity Style | Large Cap Growth |
| Broad Asset Class | US Equity |
| Broad Category | Equity |
| Global Peer Group | Equity US |
| Peer Group | Large-Cap Growth Funds |
| Global Macro | Equity North America |
| US Macro | Large-Cap Funds |
| YCharts Categorization | -- |
| YCharts Benchmark | -- |
| Prospectus Objective | Growth Funds |
| Fund Owner Firm Name | Fidelity Investments |
| Broad Asset Class Benchmark Index | |
| ^SPXTR | 100.0% |