

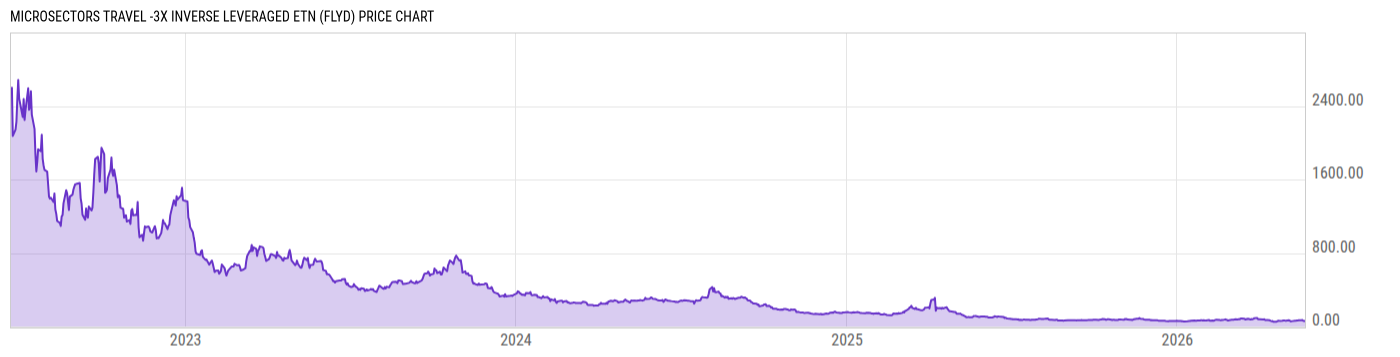
MicroSectors Travel -3X Inverse Leveraged ETN (FLYD)
66.75
-0.34
(-0.51%)
USD |
NYSEARCA |
May 18, 16:00
Price Chart
Key Stats
| Net Expense Ratio | Discount or Premium to NAV | Total Assets Under Management | 30-Day Average Daily Volume |
|---|---|---|---|
| 0.95% | -0.09% | 6.682M | 3315.10 |
| Weighted Average Dividend Yield | Turnover Ratio (Generic) | 1 Year Fund Level Flows | Max Drawdown (Since Inception) |
| -- | -- | 7.209M |
Basic Info
| Investment Strategy | |
| The Fund seeks three times leveraged participation in the daily inverse performance of the MerQube MicroSectors Travel Index, compounded daily. The Index is a total return index that tracks the stock prices of U.S. listed securities that are materially engaged in specified segments of the travel industry. |
| General | |
| Security Type | Exchange-Traded Fund |
| Equity Style | -- |
| Broad Asset Class | Alternative |
| Broad Category | Alternative Strategies |
| Global Peer Group | Alternative Dedicated Short Bias |
| Peer Group | Dedicated Short Bias Funds |
| Global Macro | Liquid Alternatives |
| US Macro | Alternative Equity Funds |
| YCharts Categorization | -- |
| YCharts Benchmark | -- |
| Prospectus Objective | Dedicated Short Bias Funds |
| Fund Owner Firm Name | BMO Global Asset Management |
| Broad Asset Class Benchmark Index | |
| ^MSACWINTR | 100.0% |
Performance Versus Peer Group
Annual Total Returns Versus Peers
As of May 19, 2026.
Asset Allocation
| Type | % Net |
|---|
Basic Info
| Investment Strategy | |
| The Fund seeks three times leveraged participation in the daily inverse performance of the MerQube MicroSectors Travel Index, compounded daily. The Index is a total return index that tracks the stock prices of U.S. listed securities that are materially engaged in specified segments of the travel industry. |
| General | |
| Security Type | Exchange-Traded Fund |
| Equity Style | -- |
| Broad Asset Class | Alternative |
| Broad Category | Alternative Strategies |
| Global Peer Group | Alternative Dedicated Short Bias |
| Peer Group | Dedicated Short Bias Funds |
| Global Macro | Liquid Alternatives |
| US Macro | Alternative Equity Funds |
| YCharts Categorization | -- |
| YCharts Benchmark | -- |
| Prospectus Objective | Dedicated Short Bias Funds |
| Fund Owner Firm Name | BMO Global Asset Management |
| Broad Asset Class Benchmark Index | |
| ^MSACWINTR | 100.0% |