

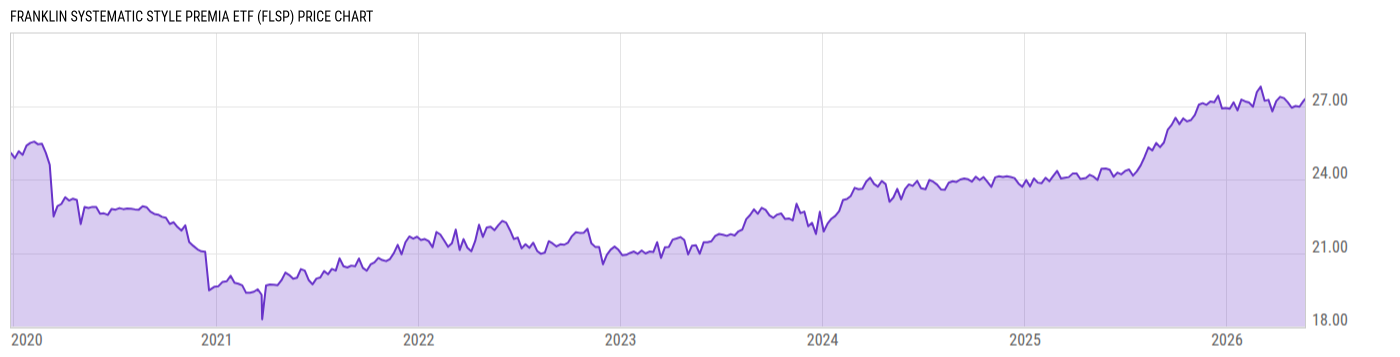
Franklin Systematic Style Premia ETF (FLSP)
27.44
-0.04
(-0.15%)
USD |
NYSEARCA |
Jun 09, 16:00
Price Chart
Key Stats
| Net Expense Ratio | Discount or Premium to NAV | Total Assets Under Management | 30-Day Average Daily Volume |
|---|---|---|---|
| 0.65% | 0.63% | 927.12M | 62232.77 |
| Weighted Average Dividend Yield | Turnover Ratio (Generic) | 1 Year Fund Level Flows | Max Drawdown (Since Inception) |
| -- | 8.00% | 507.36M |
Basic Info
| Investment Strategy | |
| The Fund seeks absolute return. The Fund allocates its assets across two underlying alternative investment strategies, which represent top-down and bottom-up approaches to capturing factor-based risk premia. The strategies consist of a top-down risk premia strategy and a bottom-up long/short equity strategy. |
| General | |
| Security Type | Exchange-Traded Fund |
| Equity Style | -- |
| Broad Asset Class | Alternative |
| Broad Category | Alternative Strategies |
| Global Peer Group | Absolute Return USD Low |
| Peer Group | Absolute Return Funds |
| Global Macro | Absolute Return |
| US Macro | Alternative Equity Funds |
| YCharts Categorization | -- |
| YCharts Benchmark | -- |
| Prospectus Objective | Absolute Return Funds |
| Fund Owner Firm Name | Franklin Templeton |
| Broad Asset Class Benchmark Index | |
| ^MSACWINTR | 100.0% |
Performance Versus Peer Group
Annual Total Returns Versus Peers
As of June 10, 2026.
Asset Allocation
As of May 31, 2026.
| Type | % Net |
|---|---|
| Cash | 12.15% |
| Stock | 68.91% |
| Bond | 1.40% |
| Convertible | 0.00% |
| Preferred | 0.00% |
| Other | 17.54% |
Basic Info
| Investment Strategy | |
| The Fund seeks absolute return. The Fund allocates its assets across two underlying alternative investment strategies, which represent top-down and bottom-up approaches to capturing factor-based risk premia. The strategies consist of a top-down risk premia strategy and a bottom-up long/short equity strategy. |
| General | |
| Security Type | Exchange-Traded Fund |
| Equity Style | -- |
| Broad Asset Class | Alternative |
| Broad Category | Alternative Strategies |
| Global Peer Group | Absolute Return USD Low |
| Peer Group | Absolute Return Funds |
| Global Macro | Absolute Return |
| US Macro | Alternative Equity Funds |
| YCharts Categorization | -- |
| YCharts Benchmark | -- |
| Prospectus Objective | Absolute Return Funds |
| Fund Owner Firm Name | Franklin Templeton |
| Broad Asset Class Benchmark Index | |
| ^MSACWINTR | 100.0% |