

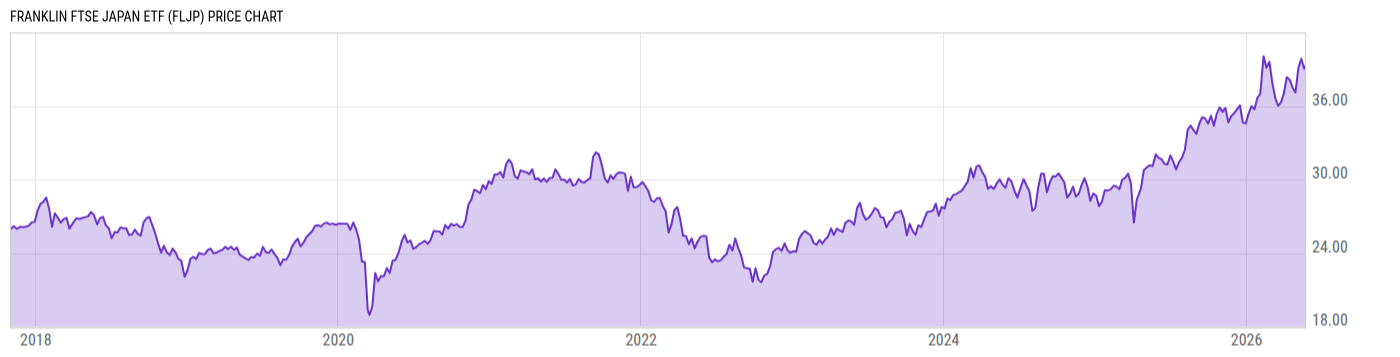
Franklin FTSE Japan ETF (FLJP)
38.94
-0.32
(-0.80%)
USD |
NYSEARCA |
Jun 09, 16:00
38.94
0.00 (0.00%)
After-Hours: 19:26
Price Chart
Key Stats
| Net Expense Ratio | Discount or Premium to NAV | Total Assets Under Management | 30-Day Average Daily Volume |
|---|---|---|---|
| 0.09% | 1.37% | 3.672B | 1.141M |
| Weighted Average Dividend Yield | Turnover Ratio (Generic) | 1 Year Fund Level Flows | Max Drawdown (Since Inception) |
| 1.79% | 4.00% | 904.76M |
Basic Info
| Investment Strategy | |
| The Fund seeks to provide investment results that closely correspond to the performance of the FTSE Japan RIC Capped. The Fund invests at least 80% of its assets in the component securities of the underlying index which is designed to measure the performance of Japanese large- and mid-capitalization stocks. |
| General | |
| Security Type | Exchange-Traded Fund |
| Equity Style | Multi Cap Core |
| Broad Asset Class | International Equity |
| Broad Category | Equity |
| Global Peer Group | Equity Japan |
| Peer Group | Japanese Funds |
| Global Macro | Equity Asia Pacific |
| US Macro | Developed International Markets Funds |
| YCharts Categorization | -- |
| YCharts Benchmark | -- |
| Prospectus Objective | Japanese Funds |
| Fund Owner Firm Name | Franklin Templeton |
| Broad Asset Class Benchmark Index | |
| ^MSACXUSNTR | 100.0% |
Performance Versus Peer Group
Annual Total Returns Versus Peers
As of June 09, 2026.
Asset Allocation
As of May 31, 2026.
| Type | % Net |
|---|---|
| Cash | 0.09% |
| Stock | 99.18% |
| Bond | 0.00% |
| Convertible | 0.00% |
| Preferred | 0.00% |
| Other | 0.74% |
Basic Info
| Investment Strategy | |
| The Fund seeks to provide investment results that closely correspond to the performance of the FTSE Japan RIC Capped. The Fund invests at least 80% of its assets in the component securities of the underlying index which is designed to measure the performance of Japanese large- and mid-capitalization stocks. |
| General | |
| Security Type | Exchange-Traded Fund |
| Equity Style | Multi Cap Core |
| Broad Asset Class | International Equity |
| Broad Category | Equity |
| Global Peer Group | Equity Japan |
| Peer Group | Japanese Funds |
| Global Macro | Equity Asia Pacific |
| US Macro | Developed International Markets Funds |
| YCharts Categorization | -- |
| YCharts Benchmark | -- |
| Prospectus Objective | Japanese Funds |
| Fund Owner Firm Name | Franklin Templeton |
| Broad Asset Class Benchmark Index | |
| ^MSACXUSNTR | 100.0% |