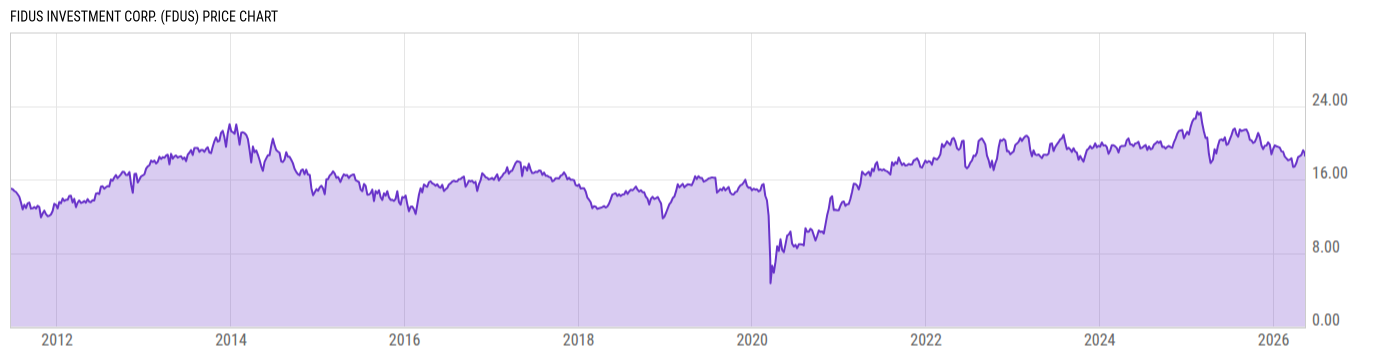
Fidus Investment Corp (FDUS)
20.67
+0.10 (+0.49%)
USD |
NASDAQ |
Feb 03, 16:00
20.64
-0.03 (-0.15%)
After-Hours: 19:59
Price Chart
Key Stats
Price and Performance | |
---|---|
Market Cap | 505.12M |
52 Week High (Daily) | Upgrade |
52 Week Low (Daily) | Upgrade |
All-Time High (Daily) | Upgrade |
Year to Date Total Returns (Daily) | Upgrade |
1 Month Total Returns (Daily) | Upgrade |
1 Year Total Returns (Daily) | 26.42% |
Valuation | |
PE Ratio | -- |
PE Ratio (Forward) | Upgrade |
PS Ratio | 4.593 |
Price to Book Value | 1.044 |
EV to EBITDA | Upgrade |
Dividend | |
---|---|
Dividend | 0.61 |
Dividend Yield (Forward) | Upgrade |
Financials | |
Revenue (5 Year Growth) | Upgrade |
Revenue (Quarterly YoY Growth) | Upgrade |
EPS Diluted (5 Year Growth) | Upgrade |
EPS Diluted (Quarterly YoY Growth) | Upgrade |
Debt to Equity Ratio | 0.7994 |
Return on Equity | Upgrade |
Return on Assets | Upgrade |
Risk | |
Beta (5Y) | Upgrade |
Max Drawdown (5Y) | 68.51% |
News
Headline
Wire
Time (ET)
Yahoo
01/31 16:05
MT Newswires
11/07 07:51
MT Newswires
10/14 09:12
--Oppenheimer Trims Fair Value Estimate on Fidus Investment to $20 From $21, Keeps Outperform Rating
MT Newswires
08/08 05:07
Globe Newswire
08/04 16:05
Events
DATE | TIME | TYPE | PERIOD | REPORTED EPS |
ESTIMATED EPS |
SURPRISE | |
03/03/2023* | -- | Results | Q4 2022 | -- | 0.50 | -- | |
03/03/2023* | 09:00 EST | Earnings Call | Q4 2022 | -- | -- | -- | |
11/04/2022 | 09:00 EST | Earnings Call | Q3 2022 | -- | -- | -- | |
11/03/2022 | -- | Results | Q3 2022 | 0.51 | 0.44 | 16.35% | |
08/05/2022 | 09:00 EST | Earnings Call | Q2 2022 | -- | -- | -- | |
08/04/2022 | -- | Results | Q2 2022 | 0.43 | 0.41 | 5.39% | |
05/06/2022 | 09:00 EST | Earnings Call | Q1 2022 | -- | -- | -- | |
05/05/2022 | -- | Results | Q1 2022 | 0.42 | 0.39 | 6.60% |
*Estimated Date/Time
Earnings
Profile
Edit
Fidus Investment Corp is an externally managed, closed-end, non-diversified management investment company that has elected to be treated as a business development company. The company provides customized debt and equity financing solutions to lower middle-market companies, which management generally defines as U.S. based companies with revenues between $10 million and $150 million. The company's investment objective is to provide attractive risk-adjusted returns by generating both current income from debt investments and capital appreciation from equity-related investments. |
URL | http://www.fdus.com |
Investor Relations URL | https://investor.fdus.com/ |
HQ State/Province | Illinois |
Sector | Financial Services |
Industry | Asset Management |
Equity Style | Small Cap/Value |
Next Earnings Release | Mar. 03, 2023 (est.) |
Last Earnings Release | Nov. 03, 2022 |
Next Ex-Dividend Date | N/A |
Last Ex-Dividend Date | Dec. 01, 2022 |
Analyst Coverage
Consensus Rating
|
|
Analyst Recommendation
|
Source: S&P Global
Dividends
Dividend Per Share (TTM) | 1.36 |
2017
2018
2019
2020
2021
6.00%
4.00%
2.00%
|
|
Yield to Market | 5.983 |
Yield to Sector | 2.382 |
Yield to Industry | 2.786 |
Last Dividend Amt. | 0.61 |
Dividend Frequency | Quarterly |
Last Ex-Dividend Date | Dec. 01, 2022 |
Yield (TTM) | 7.69% |
Forward Yield | 9.19% |
Payout Ratio | 44.48% |
Cash Payout Ratio | 141.8% |
Consistent Payer (5Y) |
|
Consistent Growth (5Y) | No |
Risk Info
Total Returns Comparison
Annual Total Returns Versus Peers
As of February 03, 2023.
Fundamentals
Revenue (TTM) | 109.98M |
Total Expenses (TTM) | -- |
Net Income (TTM) | 98.35M |
Total Assets (Quarterly) | 909.12M |
Total Liabilities (Quarterly) | 425.15M |
Shareholders Equity (Quarterly) | 483.98M |
Ratings
Profile
Edit
Fidus Investment Corp is an externally managed, closed-end, non-diversified management investment company that has elected to be treated as a business development company. The company provides customized debt and equity financing solutions to lower middle-market companies, which management generally defines as U.S. based companies with revenues between $10 million and $150 million. The company's investment objective is to provide attractive risk-adjusted returns by generating both current income from debt investments and capital appreciation from equity-related investments. |
URL | http://www.fdus.com |
Investor Relations URL | https://investor.fdus.com/ |
HQ State/Province | Illinois |
Sector | Financial Services |
Industry | Asset Management |
Equity Style | Small Cap/Value |
Next Earnings Release | Mar. 03, 2023 (est.) |
Last Earnings Release | Nov. 03, 2022 |
Next Ex-Dividend Date | N/A |
Last Ex-Dividend Date | Dec. 01, 2022 |
Risk Info
Ownership
Insider Ownership Percentage | Upgrade |
Jul '20
Nov '20
Mar '21
80.00%
40.00%
10.00%
Analyst Coverage
Consensus Rating
|
|
Analyst Recommendation
|
Source: S&P Global
Top Fund Holders
Symbol | Dollars Invested | % Weight |
---|---|---|
F00001CZ51 | 774.00 USD | 7.74% |
F00001D6LV | 555.00 USD | 5.55% |
BDCAOX | 544.00 USD | 5.44% |
F00001CLJ2 | 304642.0 USD | 3.05% |
F0000170IO | 286705.0 USD | 2.87% |
PBDC | 94579.00 USD | 1.56% |
BIZD | 6.640M USD | 1.14% |
MFC6848 | 731560.0 USD | 0.22% |
Other Resources
Whale Wisdom | 13F Filings |
Seeking Alpha | Call Transcripts |
Nasdaq | Insider Trading |
Nasdaq | Institutional Ownership |
Nasdaq | Option Chain |
SEC | SEC Filings |
FDUS Tweets |