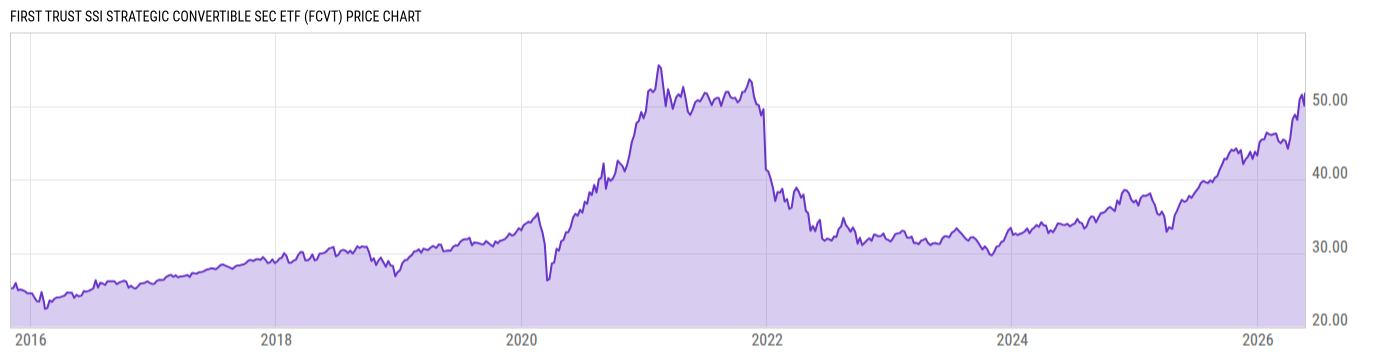
First Trust SSI Strat Convert Secs ETF (FCVT)
32.57
-0.09 -0.28%
NASDAQ
Dec 9, 14:06
Delayed 2m
USD
Key Stats
Expense Ratio | 0.95% |
Total Assets Under Management | 213.86M |
Share Class Assets Under Management | 213.86M |
30-Day Average Daily Volume | 64363.13 |
Net Asset Value | 32.65 |
Discount or Premium to NAV | 0.03% |
Turnover Ratio | 71.00% |
1 Year Fund Level Flows | -17.13M |
View All FCVT News
News
-
WireHeadlineTime (ET)
-
Business Wire11/20 16:24
-
Business Wire10/21 16:42
-
Business Wire09/24 17:27
-
Business Wire08/20 16:27
-
Business Wire07/22 16:31
-
Business Wire07/11 16:26
-
Business Wire06/24 16:14
-
Business Wire06/13 16:51
-
Business Wire05/20 16:37
-
Business Wire04/22 16:24
Performance & Returns
Total Return (Price) | Total Return (NAV) | Cat. Total Return (NAV) | % Rank in Cat. (NAV) | |
---|---|---|---|---|
1M | 3.52% | 3.13% | 2.35% | 19 |
3M | 3.98% | 3.93% | 3.23% | 23 |
6M | 7.47% | 7.25% | 6.97% | 46 |
YTD | 20.38% | 19.76% | 19.01% | 46 |
1Y | 15.74% | 15.35% | 14.63% | 47 |
3Y | 10.12% | 10.64% | 10.14% | 54 |
5Y | -- | -- | 6.77% | -- |
10Y | -- | -- | 8.77% | -- |
15Y | -- | -- | 6.85% | -- |
20Y | -- | -- | 6.97% | -- |
Asset Allocation
Type | % Net | % Long | % Short |
---|---|---|---|
Cash | 1.58% | 1.58% | 0.00% |
Stock | 5.85% | 5.85% | 0.00% |
Bond | 0.00% | 0.00% | 0.00% |
Convertible | 76.57% | 76.57% | 0.00% |
Preferred | 15.99% | 15.99% | 0.00% |
Other | 0.00% | 0.00% | 0.00% |
Region Exposure
Americas | 96.83% |
North America | 96.83% |
Latin America | 0.00% |
Greater Europe | 2.60% |
United Kingdom | 0.00% |
Europe Developed | 2.60% |
Europe Emerging | 0.00% |
Africa/Middle East | 0.00% |
Greater Asia | 0.57% |
Japan | 0.00% |
Australasia | 0.00% |
Asia Developed | 0.00% |
Asia Emerging | 0.57% |
Market Classification | |
% Developed Markets | 99.43% |
% Emerging Markets | 0.57% |
Stock Sector Exposure
Basic Materials | 6.93% |
Communication Services | 0.00% |
Consumer Cyclical | 0.00% |
Consumer Defensive | 0.00% |
Energy | 0.00% |
Financial Services | 0.00% |
Healthcare | 7.81% |
Industrials | 22.28% |
Real Estate | 0.00% |
Technology | 0.00% |
Utilities | 62.97% |
Stock Market Capitalization
Giant | 0.00% |
Large | 0.00% |
Medium | 0.00% |
Small | 0.00% |
Micro | 0.00% |
Stock Style Exposure
Large Cap Value | -- |
Large Cap Blend | -- |
Large Cap Growth | -- |
Mid Cap Value | -- |
Mid Cap Blend | -- |
Mid Cap Growth | -- |
Small Cap Value | -- |
Small Cap Blend | -- |
Small Cap Growth | -- |
FCVT Bond Exposure
Government | 0.00% |
Corporate | 98.32% |
Securitized | 0.00% |
Municipal | 0.00% |
Cash | 1.68% |
Derivative | 0.00% |
FCVT Bond Credit Quality Exposure
AAA | -- |
AA | -- |
A | -- |
BBB | -- |
BB | -- |
B | -- |
Below B | -- |
FCVT Bond Maturity Exposure
1 to 7 Days | 0.00% |
8 to 30 Days | 0.00% |
31 to 90 Days | 0.00% |
91 to 182 Days | 0.00% |
183 to 364 Days | 0.81% |
1 to 3 Years | 17.39% |
3 to 5 Years | 43.49% |
5 to 7 Years | 25.36% |
7 to 10 Years | 3.70% |
10 to 15 Years | 0.45% |
15 to 20 Years | 2.83% |
20 to 30 Years | 5.98% |
Over 30 Years | 0.00% |
View More Holdings
As of Dec. 6, 2019
Top 10 Holdings
Symbol | Name | % Weight | Price | % Chg |
---|---|---|---|---|
WFCPL | Wells Fargo & Co 7 1/2 % Non Cum Perp Conv Pfd Shs -A- Series -L- | 2.88% | -- | -- |
BACPL | Bank of America Corp 7 1/4 % Non-Cum Perp Conv Pfd Shs Series -L- | 2.58% | -- | -- |
AVGOP | Broadcom Inc 8% PRF CONVERT 30/09/2022 USD 1000 Ser A | 2.02% | -- | -- |
ASSF | Microchip Technology Incorporated 1.63% | 1.86% | -- | -- |
ASSF | Akamai Technologies, Inc. 0.13% | 1.76% | -- | -- |
ASSF | DexCom Inc 0.75% | 1.69% | -- | -- |
BDXA | Becton, Dickinson and Co Pfd | 1.62% | -- | -- |
ASSF | Insulet Corporation 0.38% | 1.57% | -- | -- |
ASSF | Microchip Technology Incorporated 1.63% | 1.48% | -- | -- |
ASSF | Splunk Inc 0.5% | 1.47% | -- | -- |
Advertisement
Basic Info
Investment Strategy | |
---|---|
The investment seeks total return. Under normal market conditions, the fund seeks to achieve its investment objective by investing at least 80% of its net assets (including investment borrowings) in a portfolio of U.S. and non-U.S. convertible securities. In general, convertible securities combine the investment characteristics of bonds and common stocks and typically consist of debt securities or preferred securities that may be converted or exchanged within a specified period of time into a certain amount of common stock or other equity security of the same or a different issuer. The fund is non-diversified. | |
General | |
Security Type | Exchange-Traded Fund |
Equity Style | -- |
Fixed Income Style | -- |
Broad Asset Class | Allocation |
Broad Category | Convertibles |
Category Name | Convertibles |
Prospectus Objective | Convertible Bond |
Fund Owner Firm Name | First Trust |
Benchmark Index | |
ICE BofAML All US Convertible TR USD | 100.0% |
Reports | |
One Page Report | Download |
Manager Info
Name | Tenure |
---|---|
Ethan Ganz | 3.32 yrs |
Florian Eitner | 3.32 yrs |
George Douglas | 3.32 yrs |
Michael Opre | 3.32 yrs |
Ravi Malik | 3.32 yrs |
Net Fund Flows
1M | 6.484M |
3M | 6.484M |
6M | 6.446M |
YTD | 23.65M |
1Y | -17.13M |
3Y | 170.03M |
5Y | -- |
10Y | -- |
Risk Info
Beta (5Y) | 0.6557 |
Max Drawdown (All) | 14.24% |
Historical Sharpe Ratio (10Y) | -- |
Historical Sortino (All) | 1.182 |
30-Day Rolling Volatility | 6.92% |
Daily Value at Risk (VaR) 1% (All) | 2.48% |
Monthly Value at Risk (VaR) 1% (All) | 5.88% |
Fundamentals
General | |
---|---|
Dividend Yield TTM (12-9-19) | 1.51% |
30-Day SEC Yield (10-31-19) | 0.61% |
7-Day SEC Yield | -- |
Forecasted Dividend Yield | -- |
Number of Holdings | 134 |
Stock | |
Weighted Average PE Ratio | -- |
Weighted Average Price to Sales Ratio | -- |
Weighted Average Price to Book Ratio | -- |
Weighted Median ROE | -- |
Weighted Median ROA | -- |
Forecasted PE Ratio | -- |
Forecasted PS Ratio | -- |
Forecasted Price to Book Value | -- |
Number of Stock Holdings | 9 |
Bond | |
Current Yield | 1.39% |
Yield to Maturity | 6.07% |
Effective Duration | 2.27 |
Average Coupon | 1.54% |
Average Credit Score | -- |
Average Price | -- |
Number of Bond Holdings | 0 |
Attributes
Key Dates | |
---|---|
Inception Date | 11/3/2015 |
Termination Date | |
Last Annual Report Date | 10/31/2018 |
Last Prospectus Date | 3/1/2019 |
Attributes | |
Exchange Traded Share | Yes |
Exchange Traded Note | No |
Enhanced Index Fund | No |
Fixed Distribution Fund | No |
High-Net Worth Individual Fund | No |
Index Fund | No |
Inverse Fund | No |
Leveraged Fund | No |
Fund of Funds | No |
Currency Hedged Fund | No |
Synthetic Replication Fund | No |
Has Dividend Investment Plan | No |
Socially Responsible Fund | No |
General Availability | |
Available for Insurance Product | No |
Available for Retirement Plan | No |
Available for RRSP | No |
Advertisement